Market Data

August 30, 2015
August at a Glance
Written by John Packard
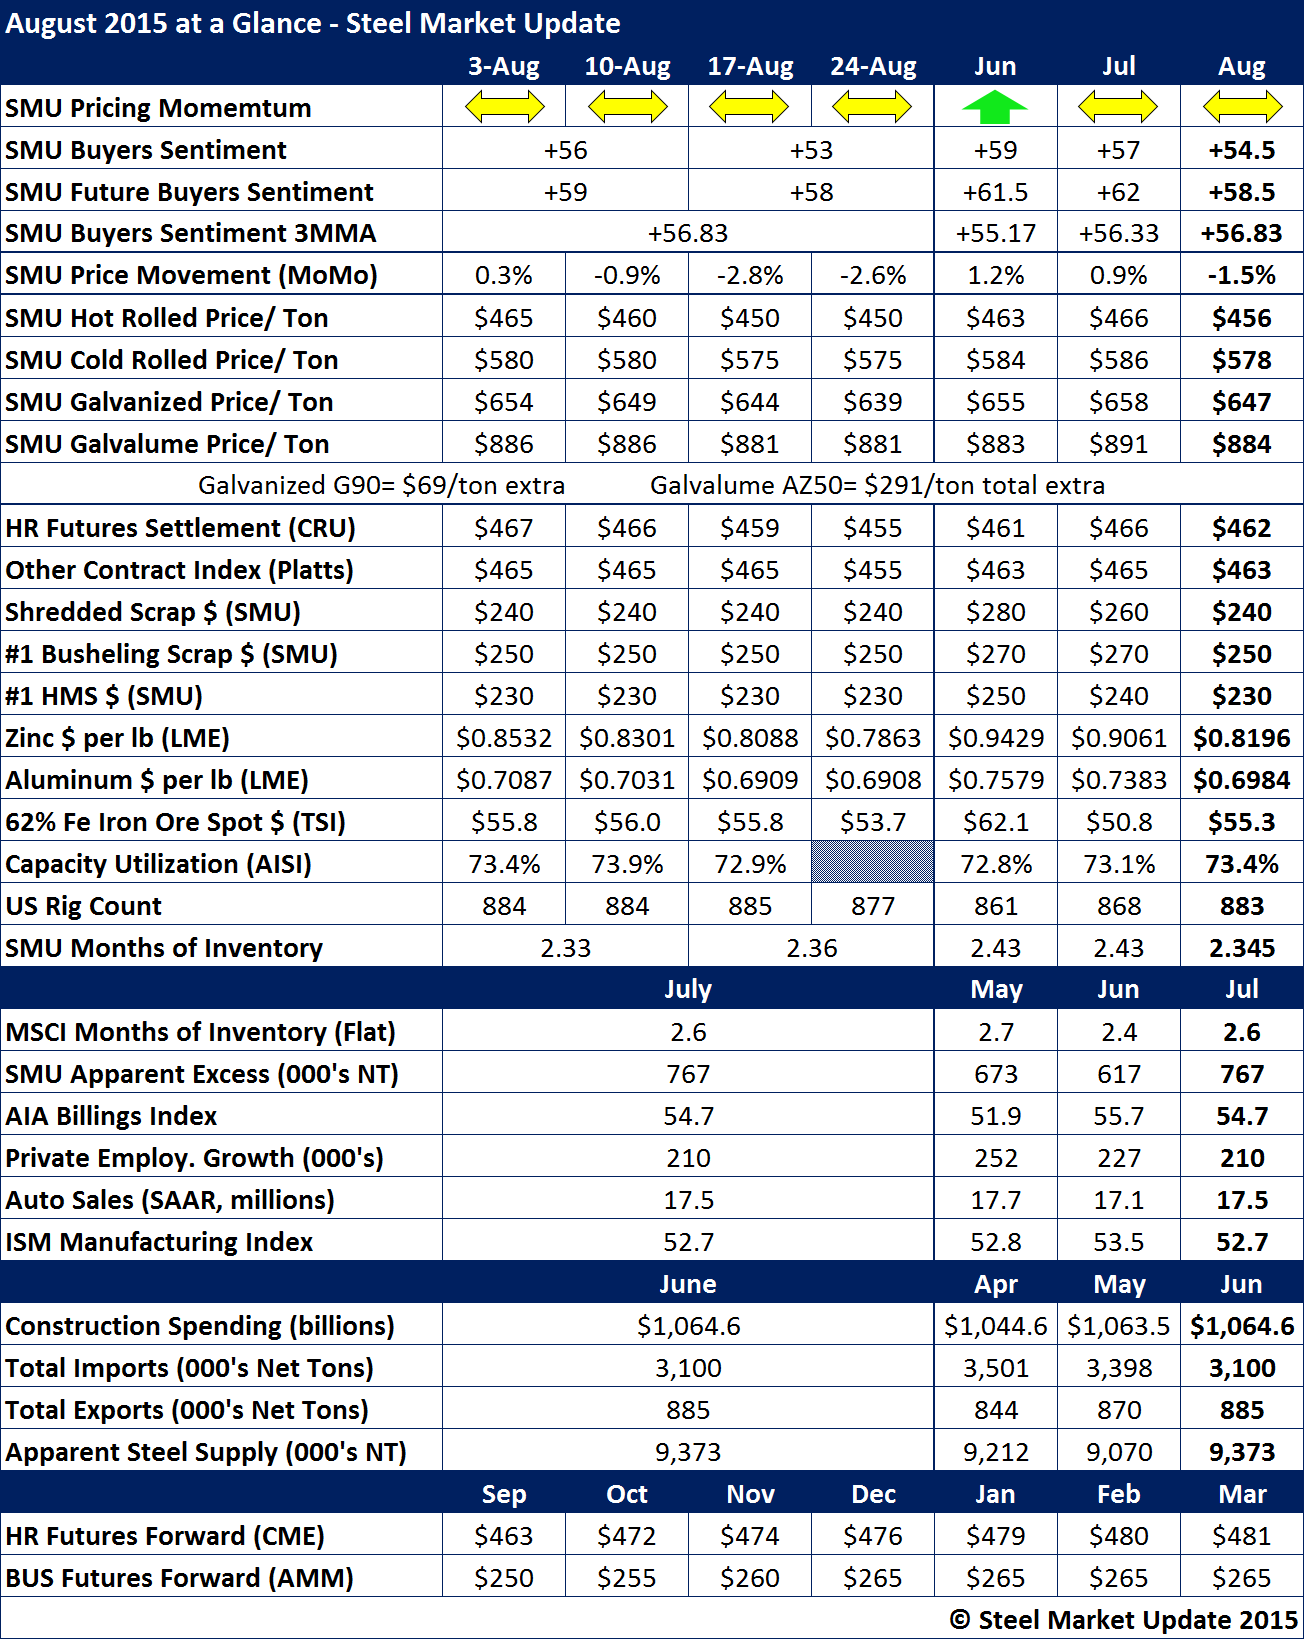
Our Steel Buyers Sentiment Index dropped for the second month in a row, however, our 3-month-moving-average rose slightly. Our Sentiment Index has been trailing what we reported during 2014 as business growth has been tempered this year versus last.
Flat rolled steel prices dropped slightly from the end of last month through the end of August. Benchmark hot rolled was down $10 per ton, cold rolled $8 per ton, galvanized $11 per ton and Galvalume $7 per ton.
SMU hot rolled coil averaged $456 per ton which was slightly lower than the $462 average produced by CRU and the $463 average of Platts.
Hot rolled futures settled at $462 per ton for the month.
Our Price Momentum Indicator remained at Neutral, even with the slippage of pricing during the course of the month. We remain at Neutral as we closely watch what will happen as the negotiations between the USW and ArcelorMittal and US Steel come to a head. SMU is not expecting any lockout or strike immediately following the expiration of the existing contract – this situation could play out for awhile (as did ATI before they locked out the union).
Scrap prices were down $10 to $20 per gross ton during the month.
Zinc and aluminum prices both declined with zinc breaking through the $0.80 per pound level on the spot LME and aluminum below $0.70 per pound.
Iron ore prices actually rallied as did rig counts.
The MSCI inventory data was disappointing and our SMU Service Center Apparent Excess/Deficit analysis had flat rolled inventories growing rather than shrinking as we expected. Excess inventories stood at 767,000 net tons at the end of July.
Steel imports are down but continue to be above 3.0 million net tons.
Apparent steel supply grew by 300,000 tons in June (most recent month we have data).