

Market Data

August 30, 2015
Key Market Indicators - August 30, 2015
Written by Peter Wright
An explanation of the Key Indicators concept is given at the end of this piece for those readers who are unfamiliar with it.
The total number of indicators considered in this analysis is currently 36.
![]()
Please refer to Table 1 for the view of the present situation and the quantitative measure of trends. Readers should regard the color codes in the present situation column as a quick look at the current market condition. This is a subjective analysis based on our opinion of the level of each indicator. The “Trend” columns of Table 1, are also by their color codes designed to give a quick visual appreciation of the direction in which the market is headed. However the quantitative analysis of the value and direction of each indicator over time are the latest “facts” available. There is nothing subjective about the trends section which is designed for those readers who want to dig deeper. All data included in this table was released in August, the month or specific date to which the data refers is shown in the second column from the far right and all data is the latest available as of August 30th.
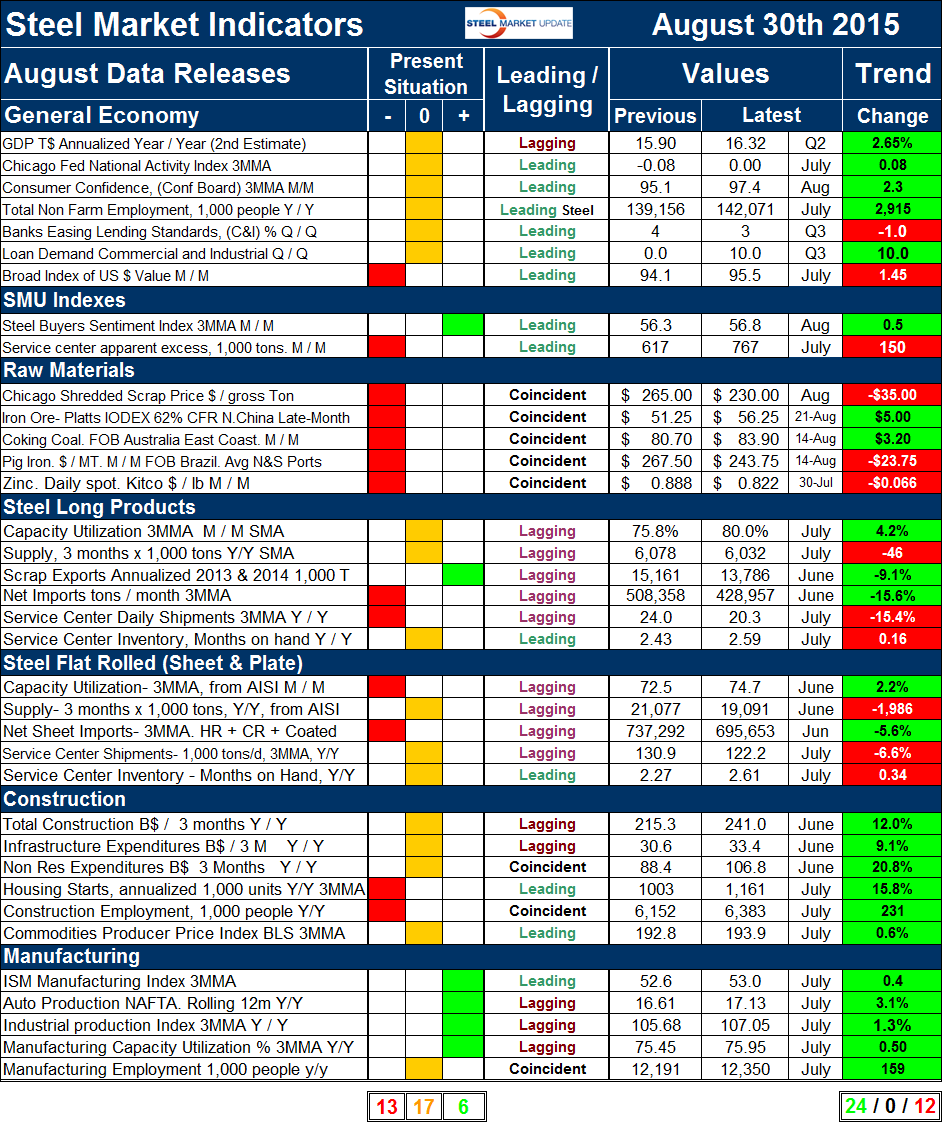
Present Situation: There was a decrease of one in the negative and an increase of one in the neutral column since the July 30th update which currently summarizes to 13 negative, 17 neutral and 6 positive. We now have 5.5 years of this analysis and have graphed the changes in the present situation and trends over time. Figure 1 shows the change in our assessment of the present situation since January 2010.
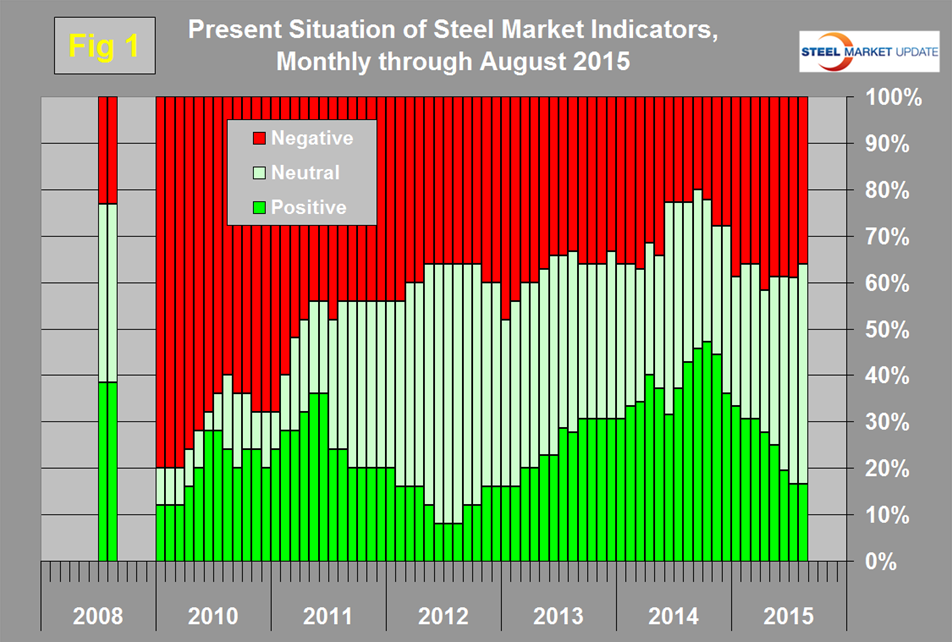
This month we went back and re-created Table 1 for August 2008 before the steel crash of September that year to evaluate whether we should “have seen it coming”. Clearly at that time the present situation was fine and in fact better than it is today. The number of indicators classified as positive peaked at 17 in October last year and now stands at 6 with a steadily declining trend. The only changes that occurred in the month of August was that we re-classified nonresidential construction expenditures from negative to neutral. GDP growth in the second quarter was revised up this week but the trailing 12 month value at 2.66 percent was below the 3.0 percent threshold that we consider to be positive. The Kitco spot price of zinc fell below 80 cents / lb. last week but recovered slightly by the 28th, it and all other raw materials prices currently have a negative present situation. Capacity utilization of the long product mills is classified as neutral and of the flat roll mills as negative. This is not an apples and apples comparison because the performance of the long product mills is based on SMA data and of the flat rolled mills on AISI data. There were no changes in our perception of the present situation of the indicators describing the long product or flat rolled steel market, or the construction and manufacturing sectors. A quick visual appraisal of the present situation shows that the general economy is basically neutral. Steelmaking raw materials are historically weak through August’s data. The present situation of the flat rolled steel sector is very similar to that for long products. Construction continues to be weak to neutral and manufacturing continues to be neutral to strong. No indicators are currently rated positive in the construction category. None of the manufacturing indicators on a present situation basis are currently negative. Four are positive and one, manufacturing employment is neutral.
Trends: Twenty four of thirty six indicators are trending positive on August 30th which was an increase of four from the July 30th update. Twelve are trending negative. Figure 2 shows the trend of the trends.
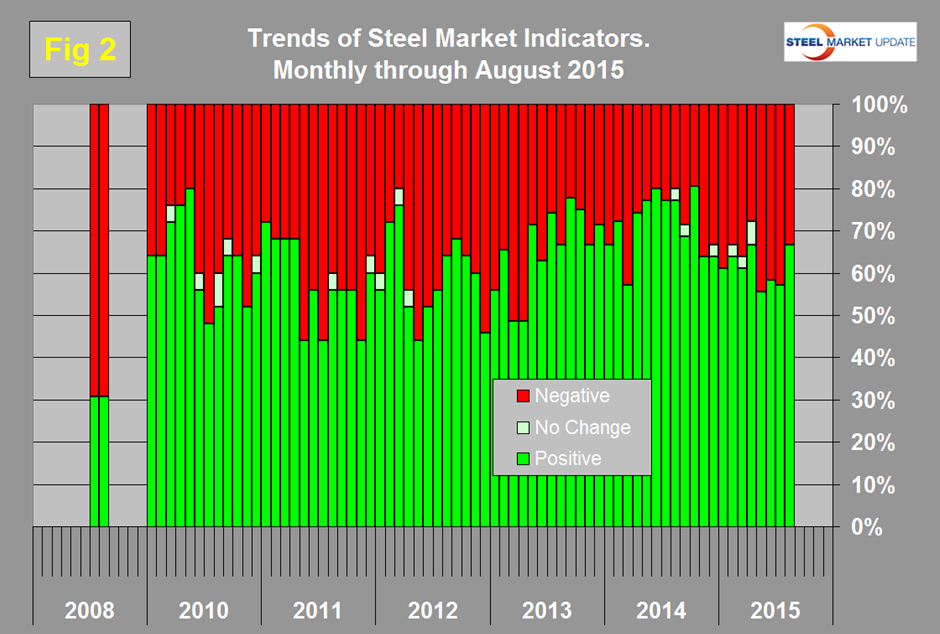
The direction of trends was fairly steady in the six months through April but then declined in May and bounced back in the latest data. The question is often asked, “Should we have seen the September 2008 disaster coming?” The answer based on this analytical technique is a definite “Yes” though of course we could have had no idea how bad it was going to be. In August 2008 over 2/3, (69.2 percent) of our indicators were trending negative. Currently we have an almost exact reversal 66.7 percent of indicators trending positive. In spite of all the negatives in today’s press (China screwing us and the stock market in disarray to say the least), the sky is not falling as indicated by the number of indicators trending positive. This analysis is in general agreement with the SMU steel buyers sentiment index.
Changes in the individual sectors are described below. Please note in most cases this is not August data but data that was released in August for previous months.
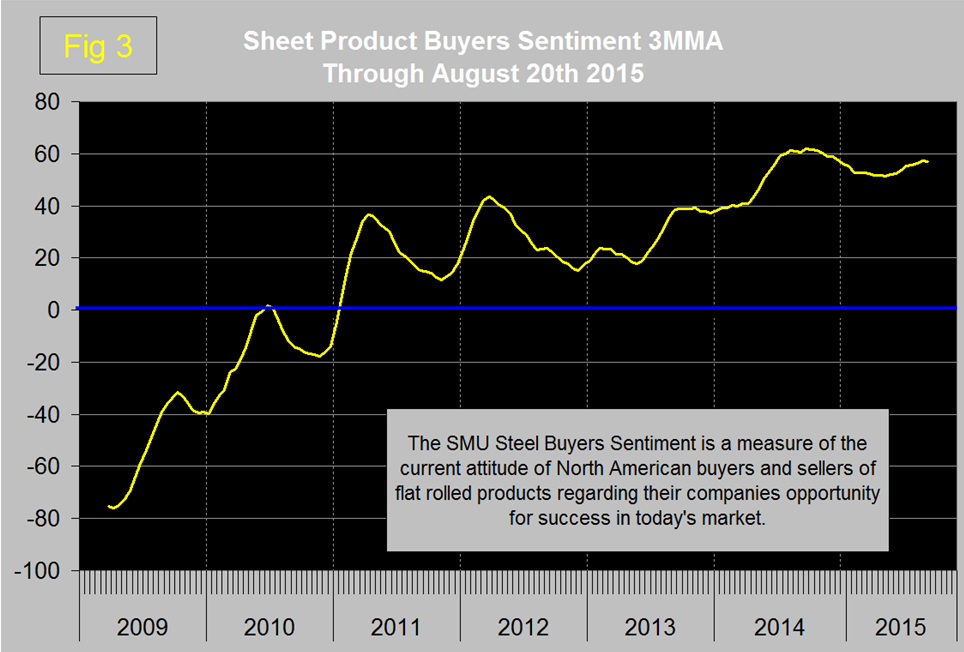
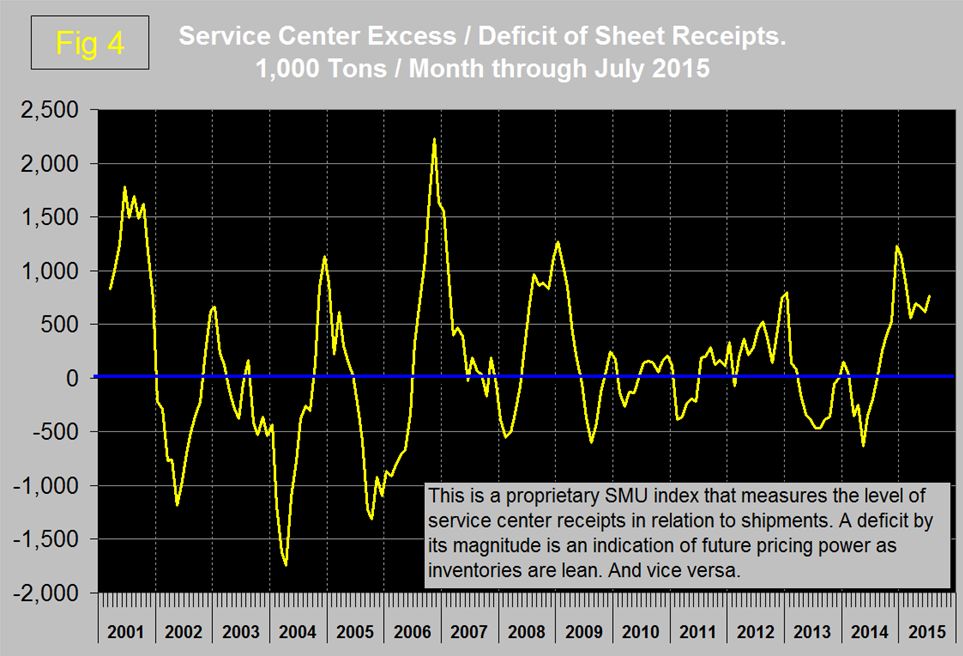
In the general economy there were two trend reversals. Consumer Confidence changed from a negative trend to positive. As we have explained elsewhere this measure has been very volatile this year. Demand for commercial and industrial loans as reported by the Federal Reserve senior loan officer survey reversed direction and became positive in the 3rd quarter. The trade weighted value of the US dollar which had been declining in May took off again in June and July which we regard as a negative for net steel imports. The trends of the two Steel Market Update proprietary indicators which had both been positive in June and July saw a reversal in the service center excess value this month. Steel buyer sentiment improved to 56.83 on August 20th and as shown in Figure 3 is still at a historical high level.
The problem this month was with the service center excess which increased to 767,000 tons. We regard this as indicative of weak pricing power going forward (Figure 4).
All five of the steel raw materials prices that we track here declined in July but in the August data, the Platts IODEX iron ore price delivered N. China and coking coal FOB Australia’s E. Coast both enjoyed small price increases. Last month we stated that, “We expect scrap prices to take another hit when the data is released by AMM in the next couple of weeks,” and this occurred with a $35 decrease in Chicago shredded. Based on our benchmark indicators we think scrap is still high. There were no trend reversals for the long product market indicators. Flat rolled had an increase of one in the positive category as net sheet imports declined, albeit from a very high level. The long products numbers are based on data from the SMA who get their data out faster than the AISI. There was no change in construction or manufacturing trends, all indicators were moving in the right direction.
The key indicators analysis somewhat bifurcated at present. Our view of the present situation is mediocre but at the same time almost 2/3 of the indicators are trending positive. SMU has several benchmark analyses that show steel demand has recovered more slowly than the general economy and is still not where it should be at this stage of a recovery.
We believe a continued examination of both the present situation and direction is a valuable tool for corporate business planning. We will be presenting this analysis at our September 1st SMU steel conference. Hope to see you there!
Explanation: The point of this analysis is to give both a quick visual appreciation of the market situation and a detailed description for those who want to dig deeper. It describes where we are now and the direction in which the market is headed and is designed to give a snapshot of the market on a specific date. The chart is stacked vertically to separate the primary indicators of the general economy, of proprietary Steel Market Update indices, of raw material prices, of both flat rolled and long product market indicators and finally of construction and manufacturing indicators. The indicators are classified as leading, coincident or lagging as shown in the third column.
Columns in the chart are designed to differentiate between where the market is today and the direction in which it is headed. It is quite possible for the present situation to be predominantly red and trends to be predominantly green and vice versa depending on the overall direction of the market. The present situation is sub-divided into, below the historical norm (-), (OK), and above the historical norm (+). The “Values” section of the chart is a quantitative definition of the market’s direction. In most cases values are three month moving averages to eliminate noise. In cases where seasonality is an issue, the evaluation of market direction is made on a year over year comparison to eliminate this effect. Where seasonality is not an issue concurrent periods are compared. The date of the latest data is identified in the third values column. Values will always be current as of the date of publication. Finally the far right column quantifies the trend as a percentage or numerical change with color code classification to indicate positive or negative direction.


