Prices

October 11, 2015
Detailed Report of Cold Rolled Imports by Port of Entry and Source
Written by Peter Wright
SMU has developed a series of foreign steel import reports that enable steel buyers and company executives to see exactly how much imported steel has entered their immediate vicinity and where it came from. This series of reports includes hot rolled, cold rolled, Hot Dipped Galvanized, other metallic coated (mainly Galvalume) as well as semi-finished steel (which are mostly slabs being imported by the domestic steel mills).
![]() We break out the data on all of our import by product, port and country into net tons (2,000 pounds) versus metric tons which is how the data is originally collected. These reports are available to our Premium level customers as well as those who are trialing our newsletter.
We break out the data on all of our import by product, port and country into net tons (2,000 pounds) versus metric tons which is how the data is originally collected. These reports are available to our Premium level customers as well as those who are trialing our newsletter.
This data can be found by clicking on the Analysis tab and then under the Import/Export Data heading at the bottom of that list will be our Imports by Port/Country (P). The “P” next to the heading means it is for Premium level customers.
This month we are highlighting the imports of cold rolled sheet for the month of August and year to date. Reports for the other products are in the computer generated format which is how we receive it. However, we thought we would begin to highlight one product per month for our Premium customers and since this is the first one we are sharing with all of our members as you may wish to upgrade your account from Executive to Premium once you become aware of the data we have in the website.
Half truths about import volume and source float around the industry on a continuous basis. Our intent is to shine a light on regional differences so our readers can evaluate the impact on their own markets better.
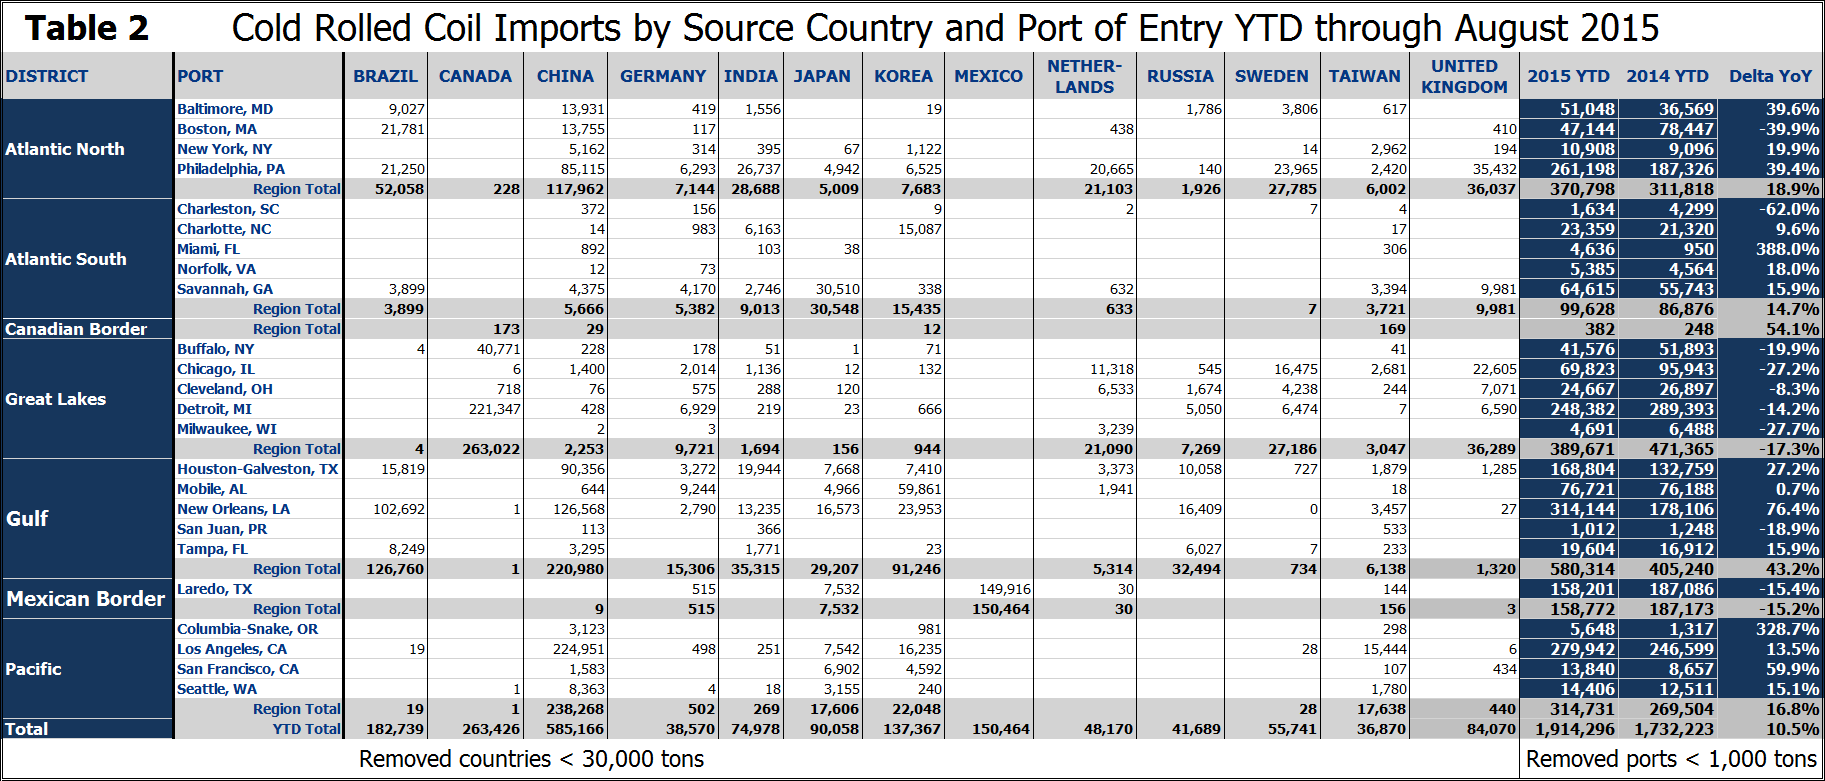
Two tables are included here for cold rolled sheet products. Countries with minimal tonnage (less than <30,000 tons) have been removed from Table 2 which describes the year to date (YTD) tonnage to make the output less cluttered. Please note that these exclusions do NOT affect the totals by district and port which are correct.
Table 1 shows a matrix of source by port of entry for each month of the year through August. The total from each country is shown at the bottom of the table. The right hand columns show the total by port for both 2015 and 2014 YTD and the percentage change year over year (Y/Y). Examples of how to read this chart are as follows; In August 27,423 tons entered the Atlantic North region and most of this came into Philadelphia and Boston. August had the second lowest tonnage of the year in the Atlantic North region but the tonnage into Boston was the highest of the year. YTD total cold rolled imports are up by 10.5% Y/Y but there is a big difference by region ranging from the Canadian Border up 54.1 percent on small tonnage to the Great Lakes region down by 17.3 percent.
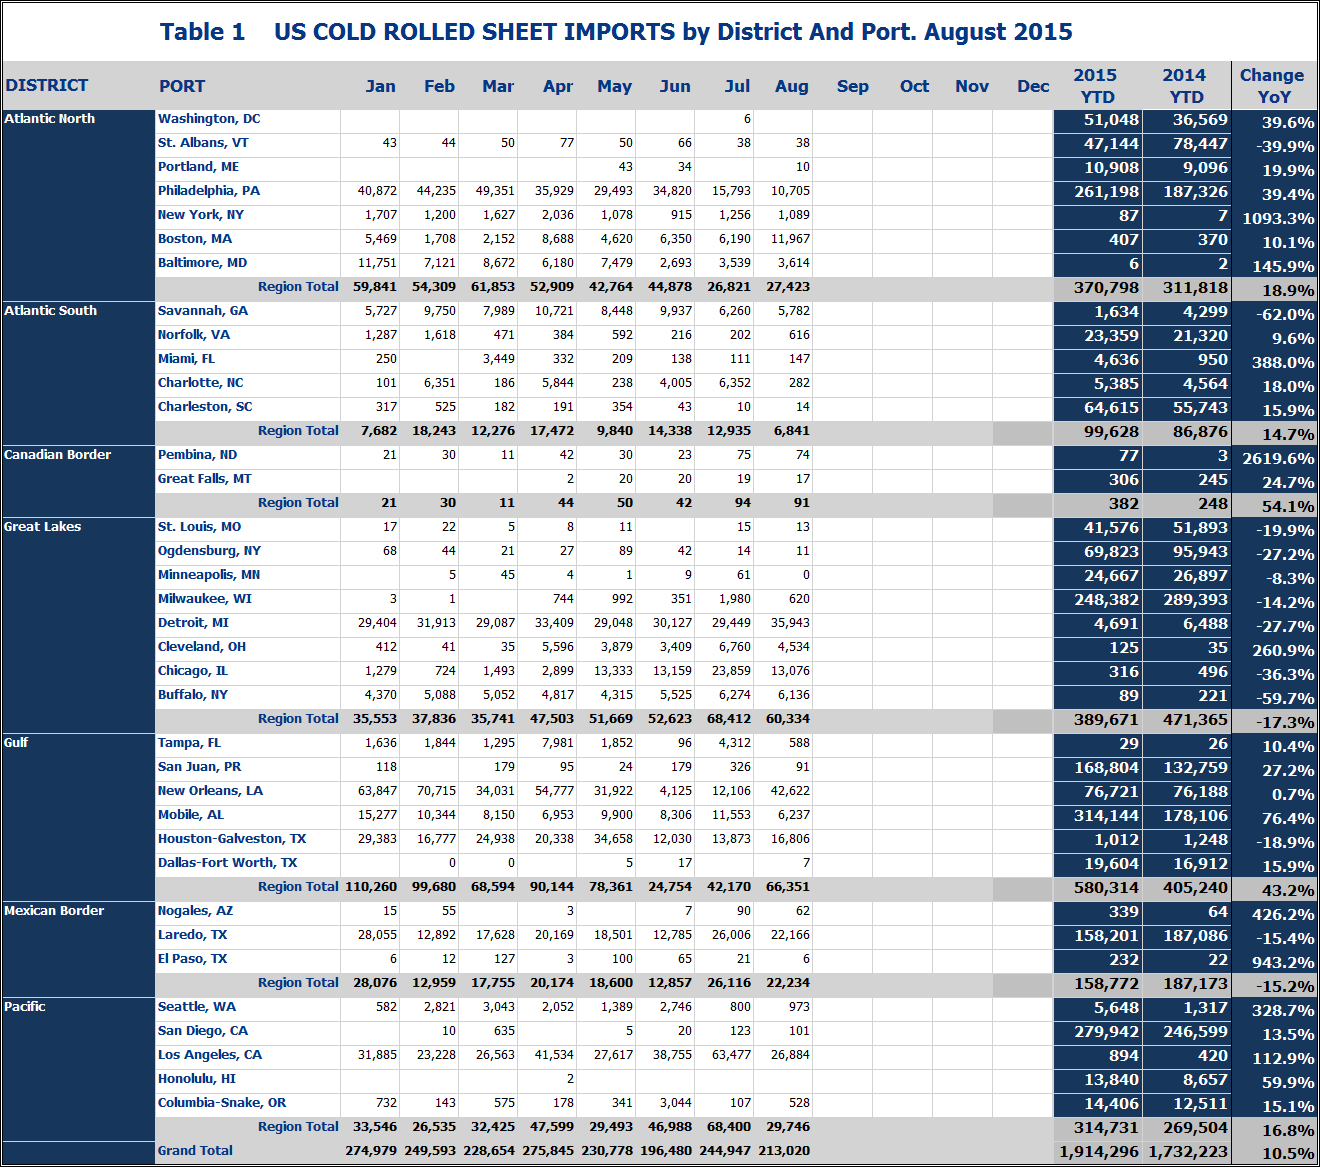
Table 2 shows the same matrix for total year to date, (YTD) tonnage. The total from each country is shown at the bottom of the table for the current year. The right hand side of the table shows tonnage YTD by port for the current year, previous year, percent change. Examples of how to read Table 2 are; 580,314 tons have entered through the Gulf this year of which 220,980 came from China. More tonnage came through New Orleans than through Houston. China has been by far the highest tonnage supplier this year with 585,166 tons YTD. Mexico has shipped 150,464 tons into the US this year, most of which crossed the river at Laredo. Full detail of how much entered the country from what source and through which port is included in Table 2.