Prices

November 12, 2015
Detailed Import Report for Galvanized Sheet by Port and Country
Written by Peter Wright
The following article is one that is produced for our Premium level members once we release the latest Imports by Product, Port & Country data into our website. In this article we want to give you a little feel for the data. Once you start reviewing imports by port you can begin to ask questions like why did imports to Charleston, SC fall off dramatically during 2015 versus prior years or, why are imports into New Orleans so high (probably being shipped by barge up the Mississippi…)?
Imports of hot dipped galvanized into your backyard could be up by as much as 111 percent this year.
SMU has developed a series of reports that enable steel buyers and company executive to see exactly how much has entered their immediate vicinity and where it came from. This series of reports includes hot rolled, cold rolled, HDG, other metallic coated (mainly Galvalume) and semi-finished slabs. All volumes are in short tons. These reports can be found clicking on the analysis tab in the Steel Market Update website and then under the Import/Export Data heading at the bottom of that list will be our Imports by Port/Country (P). The “P” next to the heading means it is for Premium level customers.
![]() This month we are highlighting the imports of hot dipped galvanized sheet. We have looked at this two ways. First by port of entry monthly for the first nine months of 2015 and secondly year to date by port of entry and point of origin. Reports for the other products listed above are in a computer generated format and a bit less comprehensible but any subscriber wanting this fine level of detail can find it as described above. Half truths about import volume and source float around the industry on a continuous basis. Our intent is to shine a light on exactly what is going on in a subscriber’s neighborhood.
This month we are highlighting the imports of hot dipped galvanized sheet. We have looked at this two ways. First by port of entry monthly for the first nine months of 2015 and secondly year to date by port of entry and point of origin. Reports for the other products listed above are in a computer generated format and a bit less comprehensible but any subscriber wanting this fine level of detail can find it as described above. Half truths about import volume and source float around the industry on a continuous basis. Our intent is to shine a light on exactly what is going on in a subscriber’s neighborhood.
In the two tables included here for HDG sheet, the ports with a very small tonnage have been removed but the district totals are correct.
Figure 1 includes October licenses and is included here to give both a long term context and to show the volume of other metallic coated products for comparison.
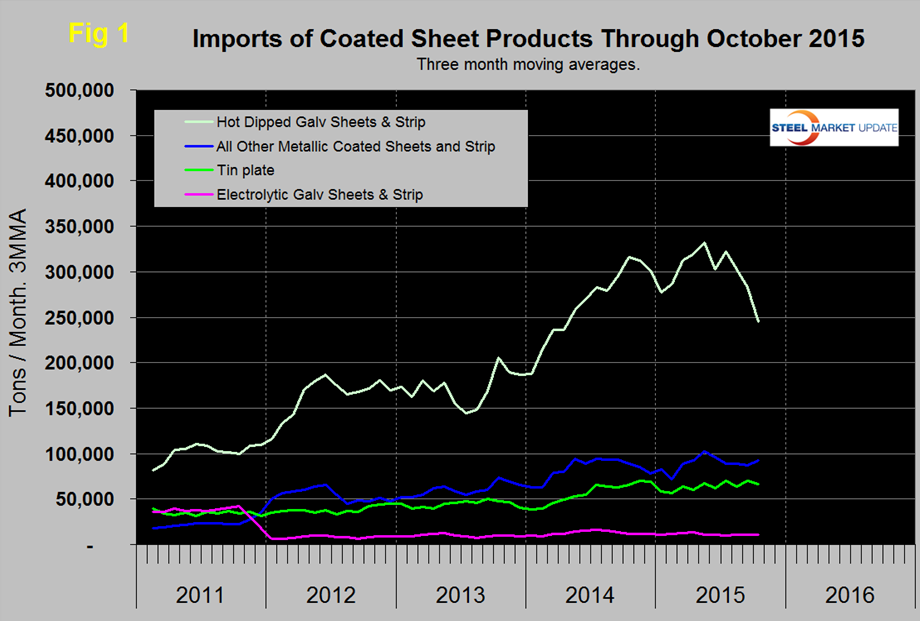
All other data in the report is final through September. The imported tonnage of HDG sheet has declined by 31.5 percent in the period July through October but is still almost three times the volume of other metallic coated (mainly Galvalume).
Table 1 shows a matrix by district and port of entry for each month of 2015 through September.
Note: If you have trouble reading the table below or any of the graphics in our newsletters, you can click on them to see a larger version.
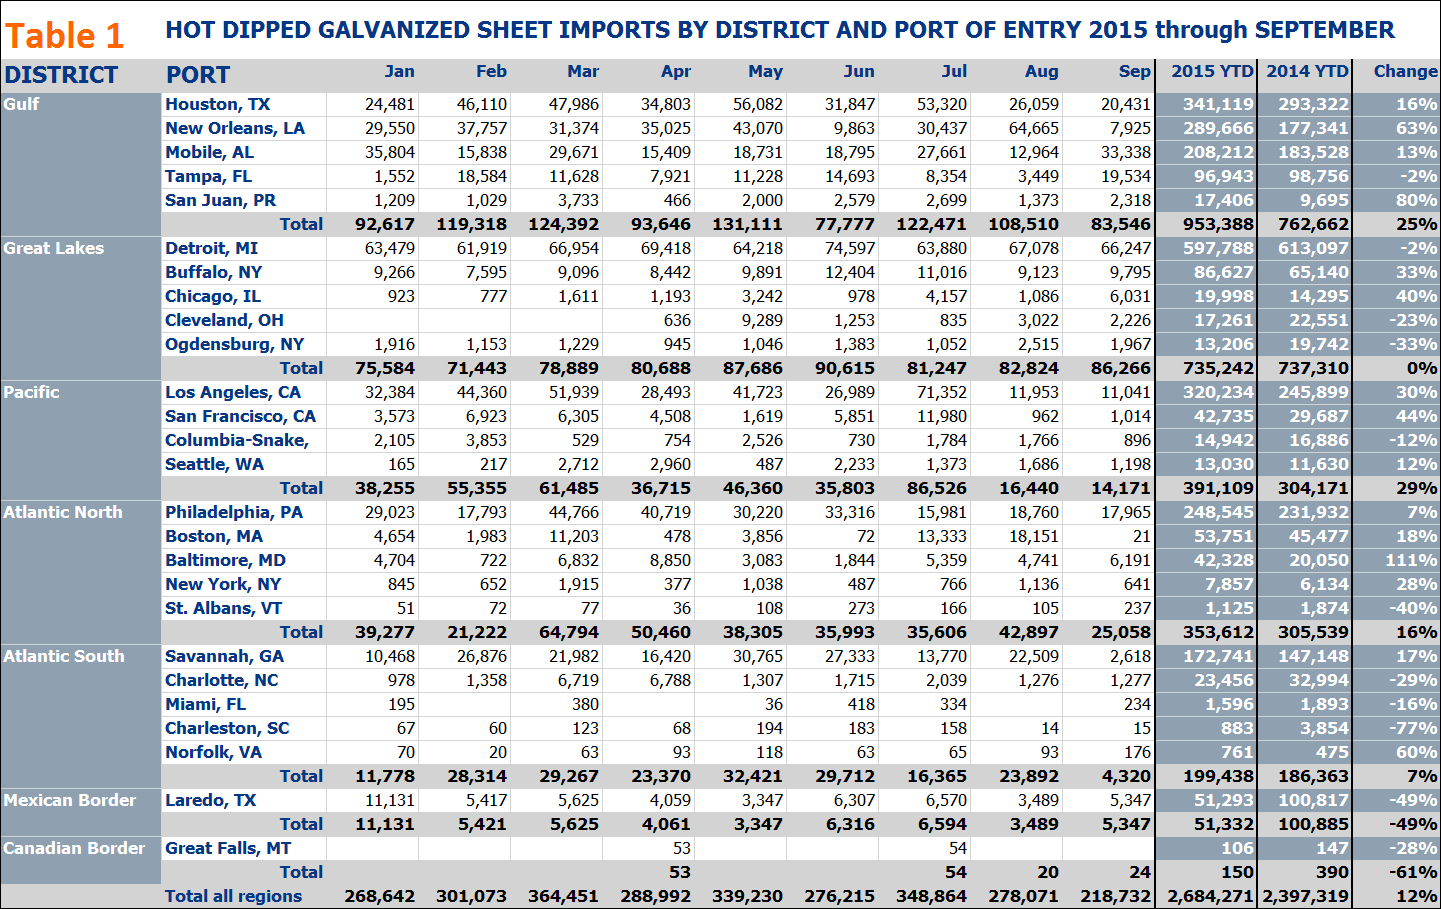
The district tonnages are sub totaled into port of entry and the right hand columns show the total by port and district for both 2015 and 2014 YTD and the percent change Y/Y. Examples of how to read this chart are as follows; In September the district with the most tonnage was the Great Lakes with 86,266 tons of which 66,247 came in through Detroit (Presumably from Canada but you have to read on to confirm that). Tonnage into the Great Lakes YTD is almost exactly the same as it was last year with tonnage increases into Chicago and Buffalo balancing decreases into Cleveland and Ogdensburg. The region with the 2nd highest tonnage in September was the Gulf with 83,546 tons. By port, Mobile received the most Gulf tonnage with 33,338 tons. The YTD total for all districts is up by 12 percent YTD. Figure 2 shows tonnage by port of entry for 2014 and 2015 compared to the total for 2014. New Orleans, Los Angeles and Houston have had the greatest Y/Y increase in that order.
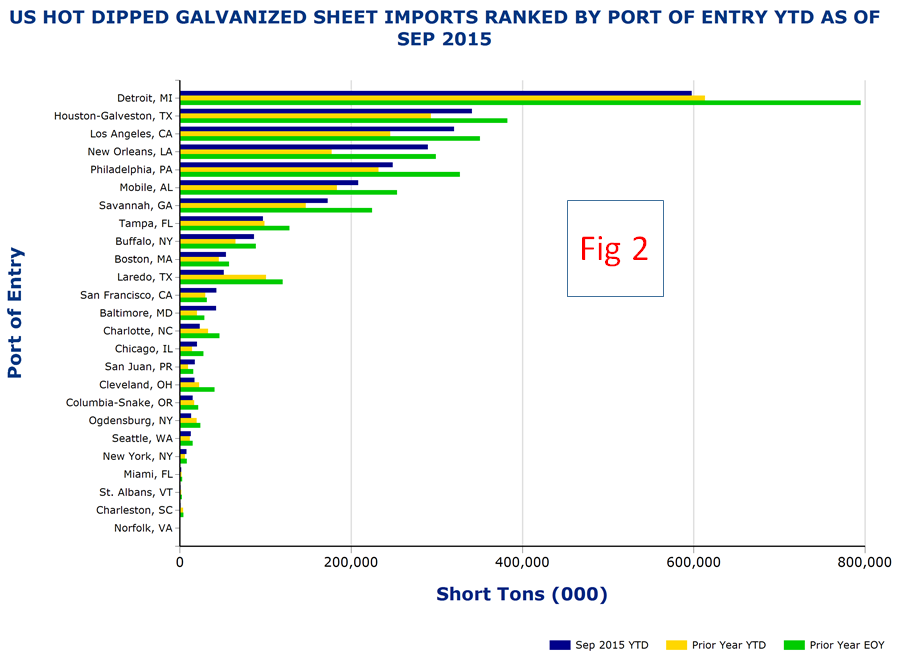
Table 2 shows a matrix for total year to date (YTD) tonnage by source country and port of entry.
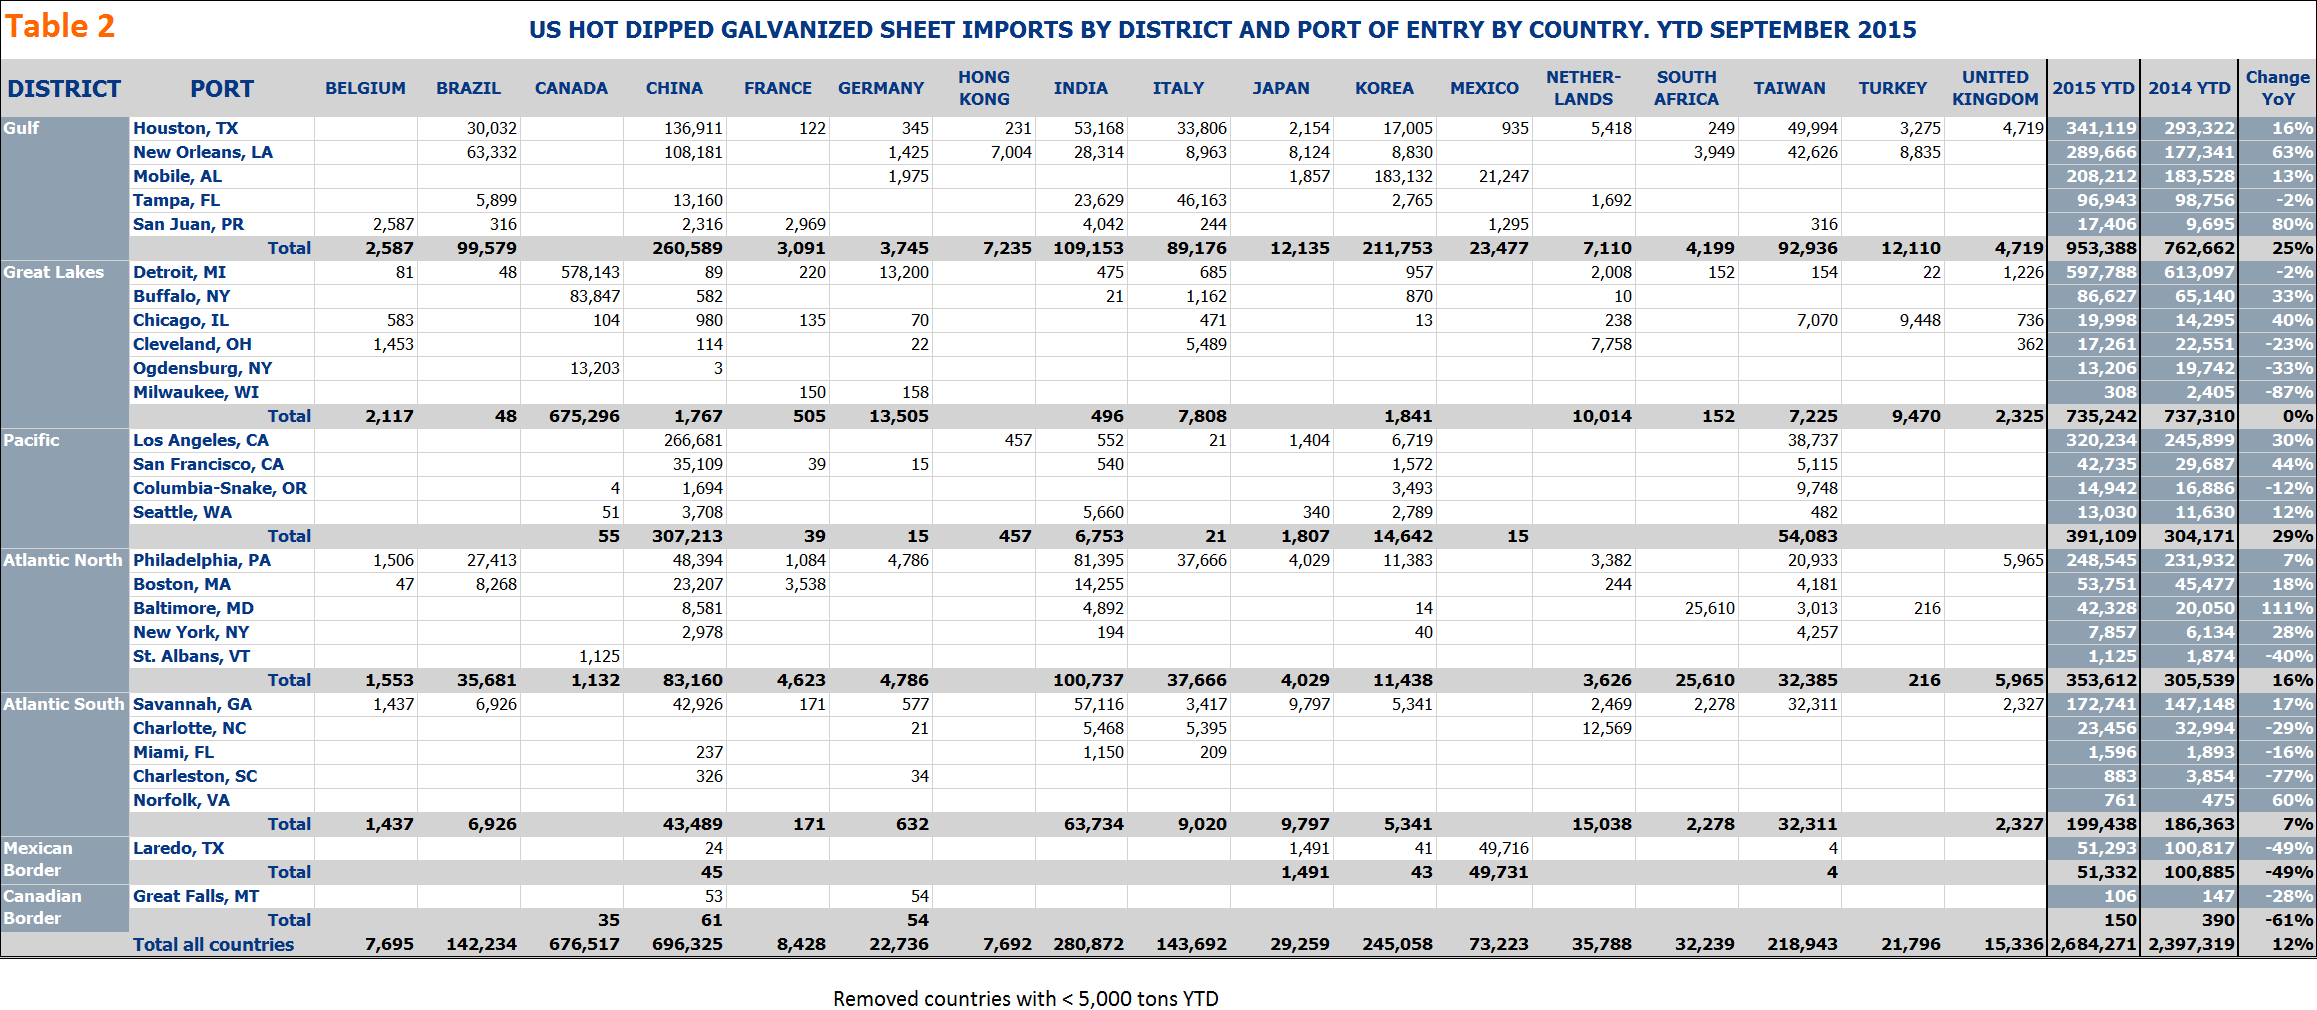
The total from each country is shown at the bottom of the table for the current year. Countries with minimal tonnage (<5,000) have been removed to make the output less cluttered. Please note that these exclusions do NOT affect the totals by district and port which are correct.
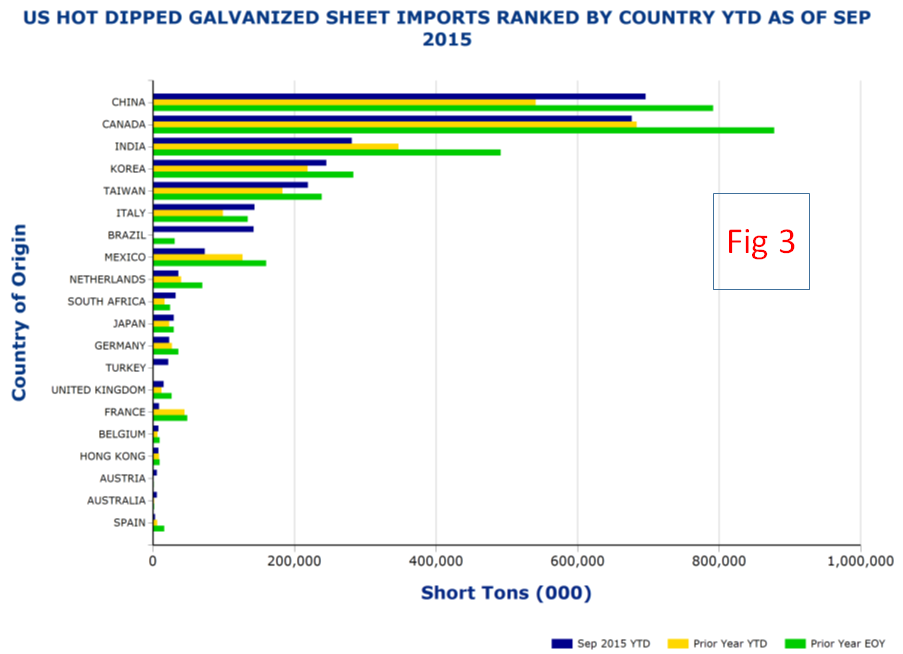
The right hand side of the table shows tonnage YTD by port for the current year, previous year and percent change. Examples of how to read Table 2 are as follows. Let’s say you are located on the West Coast. This table tells you that the tonnage of HDG into your region is up by 29 percent YTD with a total through September of 391,109 tons. Of that tonnage, the majority, 266,681 came into LA from China. We can also see that the country with the greatest tonnage into the Great Lakes is indeed Canada with 578,143 tons YTD out of a district total of 675,296 tons. India has had the 3rd highest tonnage of HDG into the US this year at 280,872 tons with Houston, Philadelphia and Savannah receiving the most. Figure 3 shows the tonnage by country YTD and the final number for 2014 for comparison. China and Brazil have had by far the greatest increase in tonnage this year and India and Mexico have faded the most.