

Market Data

November 19, 2015
Domestic Mill Lead Times Remain Flat
Written by John Packard
Twice per month, Steel Market Update (SMU) conducts an analysis of the flat rolled steel market from the perspective of active buyers and sellers of sheet and coil products. We invite approximately 560 companies to participate through the use of a questionnaire that we have been using since 2008.
One of the areas probed is in regards to North American (specifically U.S. and Canadian) steel mill lead times. We do not attempt to discover the exact lead times for new prime orders at specific mills rather we are looking for any changes in the trend over time.
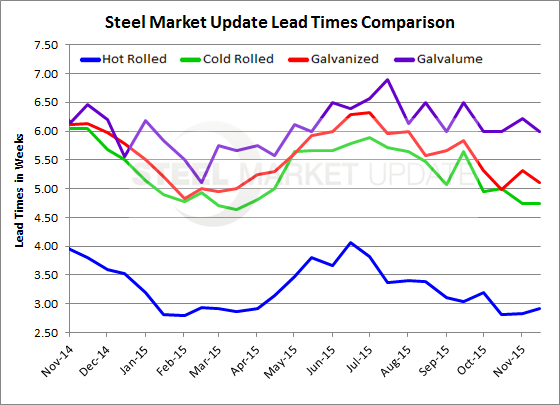
Those responding to our mid-November flat rolled steel questionnaire reported, as a group, domestic mill lead times as essentially unchanged over the past four weeks. When looking at lead times on a year over year basis we continue to see all products with shorter lead times this year compared to last.
The hot rolled average remains at just under 3 weeks (2.91 weeks, 2.82 weeks one month ago). Again, this is not the lead time for any specific mill but an average generated out of all of the respondents to this week’s market analysis questionnaire. Last year hot rolled lead times were at just under 4 weeks (3.81 weeks).
Cold rolled lead times weakened slightly from what we reported in the middle of October. The average CR lead time is now 4.75 weeks vs. the 5.00 weeks during the middle of October. One year ago CR lead times averaged 6.05 weeks.
Like HR and CR above, galvanized lead times are being reported at 5.11 weeks which is down slightly from two weeks ago (5.31 weeks) but in line with the 4.98 weeks reported during the middle of October. One year ago GI lead times averaged 6.14 weeks.
Galvalume lead times are being reported as averaging six weeks, which is the same as one month ago and one half week less than the 6.46 weeks reported at this time last year.
To see an interactive history of our Steel Mill Lead Time data, visit our website here.


