

Prices

November 19, 2015
Global Steel Production and Capacity Utilization in October 2015
Written by Peter Wright
Global steel production in 12 months through October totaled 1.609 billion tonnes with a capacity of 2.3 billion tonnes. Production in the month of October was 133,640 tonnes up from 130,998 in September or 2.0 percent, however on a tons/day basis production was 4.311 million tonnes, down from 4.367 in September and from 4.518 in April which was the highest month of the year.
![]() If we look at the three month moving average and plot it over time we see that there has been a significant decline in the second half of the year since and including 2010 which usually extends into February of the next year, after which production kicks up rapidly (Figure 1).
If we look at the three month moving average and plot it over time we see that there has been a significant decline in the second half of the year since and including 2010 which usually extends into February of the next year, after which production kicks up rapidly (Figure 1).
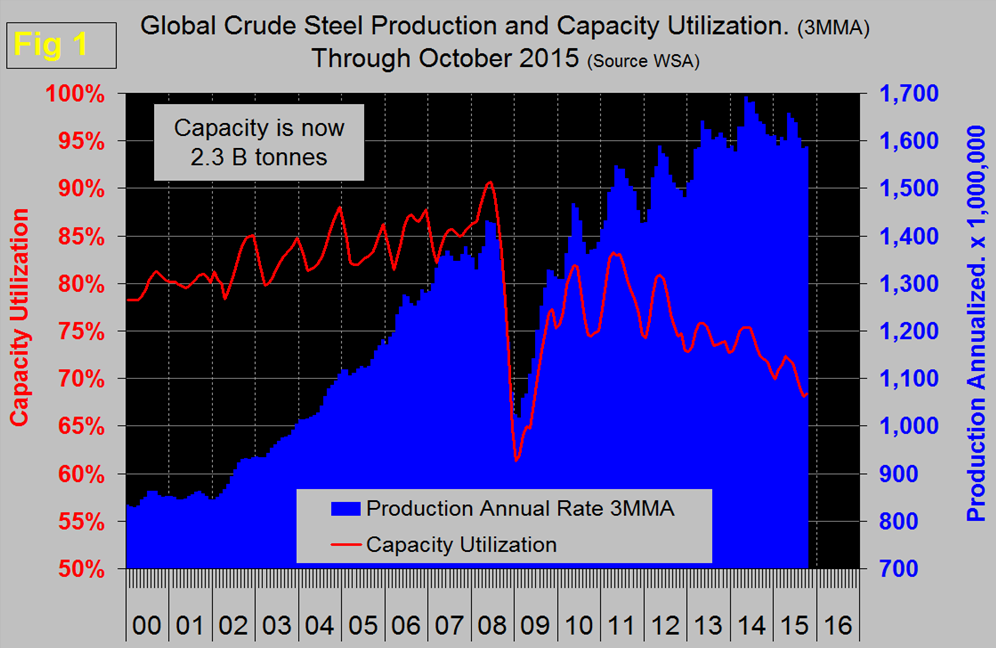
In 2015 the uptick was delayed until April and clearly the high point of 2014 won’t be reached this year. As production has increased each year since the recession, capacity utilization has decreased, the gap is widening. Capacity utilization in three months through October was 68.4 percent, down from 72.2 percent in three months through April. Capacity is estimated to be 2.3 billion tonnes/year, if we assume that the maximum sustainable capacity utilization is 90 percent then effective capacity is 2.07 billion tonnes. This means that excess (unused) capacity in 12 months through September was 2.07 minus 1.61=460 million tonnes, well over half of which is believed to be in China. This utilization figure does not bode well for a recovery in global steel prices any time soon. Last week Li Xinchuang of the China Iron & Steel Association said that China’s steel consumption would fall to less than 600 million metric tons/year by 2020, and to less than 500 million mt/y by 2030. Let’s hope that turns out to be true. China accounted for 49.5 percent of global production in October. Asia as a whole, including India, accounted for 67.9 percent.
Table 1 shows global production broken down into regions and also the production of the top ten nations in the single month of October and their share of the global total. It also shows the latest three months and twelve months production through October with year over year growth rates for each. Regions are shown in white font and individual nations in beige. If the three month growth rate exceeds the twelve month we interpret this to be a sign of positive momentum and accelerating growth.
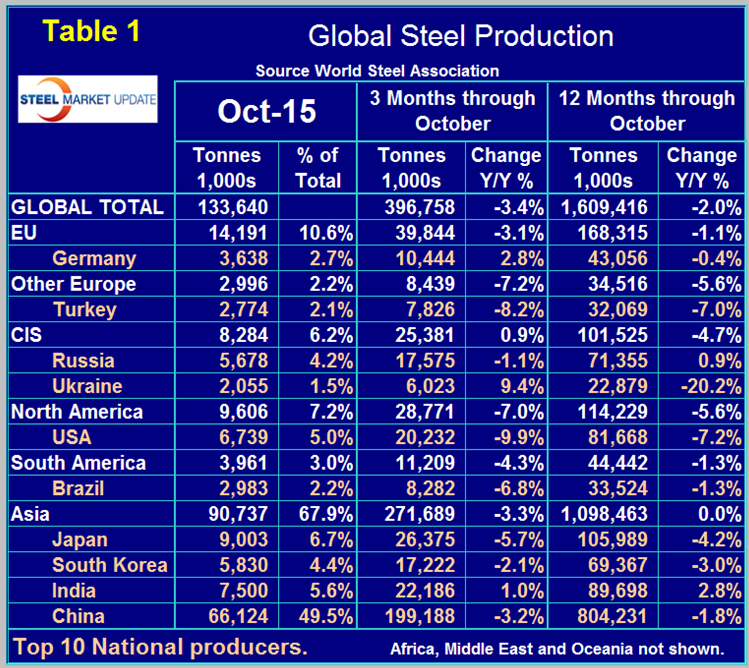
The situation this year is the reverse with negative momentum. The world as a whole currently has a negative growth of 3.4 percent in 3 months and negative 2.0 percent in 12 months. All regions except the CIS had negative growth and negative momentum in the latest data. The positive performance of the CIS was driven by Ukraine which had a growth of + 9.4 percent in three months through October year over year. Germany and India were the only other countries to have positive Y/Y growth in three months through October. In the October data China was down by 3.2 percent in three months year over year, North America was down by 7.0 percent in total with the US down by 9.9 percent, Canada down by 5.7 percent and Mexico up by 5.5 percent. The European Union was down by 3.1 percent and other Europe was down by 7.2 percent led by Turkey down by 8.2 percent.
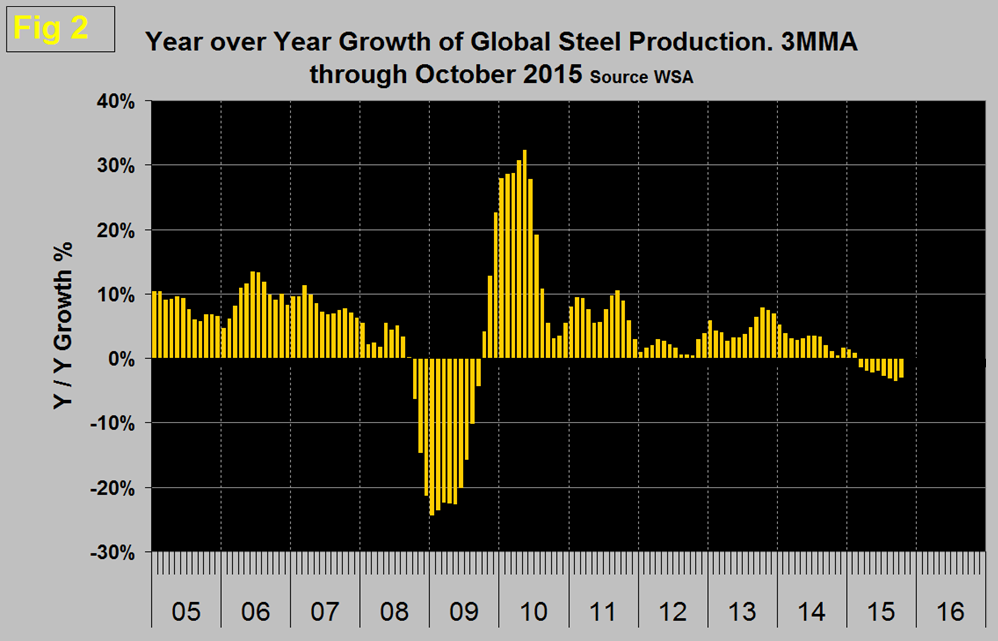
Figure 2 shows the 3MMA of the monthly year over year growth of global steel production which was negative in March for the first time since September 2009.
In October the World Steel Association publishing their latest Short Range Outlook (SRO) for apparent steel consumption in 2015 and 2016. We will leave these in our monthly updates until the April 2016 revision is released. (Note this forecast is steel consumption, not crude steel production which is the main thrust of what you are reading now.) The first table of the SRO is by region and the second for the top 10 consuming nations.
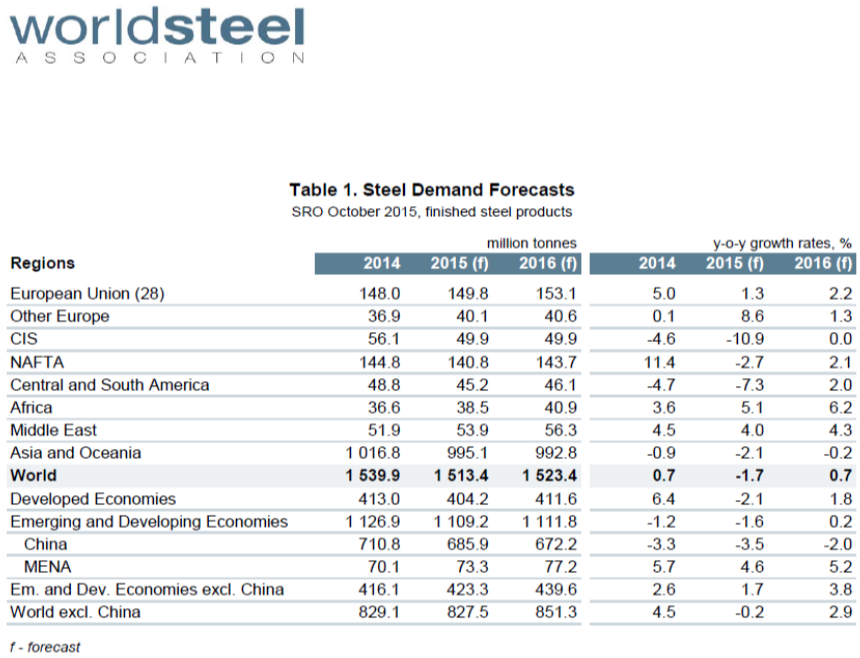
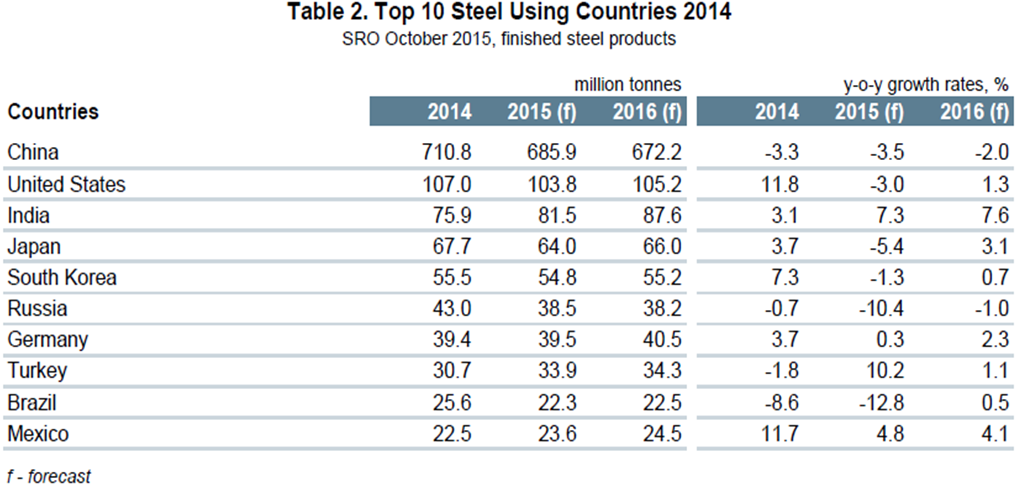
At the global level consumption must equal production in the long term with inventory adjustments interfering with that relationship in the short term. WSA are forecasting a 1.7 percent contraction in demand this year followed by a 0.7 percent expansion next year. Based on this analysis by the WSA, NAFTA will decline by 2.7 percent this year and grow by 2.1 percent next year with the US contracting by 3.0 percent and growing by 1.3 percent on the same basis.
On Monday we came across these thoughts about the self-sustaining downward spiral of global steel and iron ore on Seeking Alpha:
When Rio Tinto stubbornly sticks to bullish forecasts of Chinese steel demand and refuses to take down production, it is defending market share in a brutally competitive marketplace. When Chinese steel producers keep generating steel at negative margins, they are locked into this behavior as a method of maintaining market share and employment levels. Moreover, their behavior is still enabled and supported by lax credit conditions and state support.
Here is one way to describe the reinforcing dynamics:
• Over-optimistic expectations for Chinese steel production helped drive over-capacity into the industry.
• Production continues despite over-supply because companies need to service existing debt, preserve market share, and maintain dividends.
• Over-production and soft demand have helped to depress the price of iron ore.
• Declining prices have forced companies to slash costs in an effort to continue producing.
• Reductions in production costs have supported the ability for companies to sustain lower prices for iron ore.
• Lower prices of iron ore help support the over-production of steel given the lower costs of input. (Ditto for metallurgical coal).
• Over-production of steel helps support over-optimistic expectations of future production.
• Over-supplied steel is flooding the market and pressuring impacted markets, especially the U.S., to move to reduce Chinese imports. The contraction in China’s export markets will put additional downward pressures on steel pricing in China which in turn will pressure pricing for iron ore (at least seaborne ore) as long as steel mills can continue operating at a loss.
SMU Comment: Changes in production and consumption must be proportional in the long term and we think that the WSA forecast continues to be optimistic. They have demand declining at the global level by 1.7 percent this year but production is already down by 2.0 percent in 12 months through October and deteriorating.


