Market Data

December 1, 2015
November at a Glance
Written by John Packard
The month of November saw a continuation of lower flat rolled steel prices, Momentum and Sentiment as buyers and sellers struggle to find a bottom to what has become an extended slide going back to May 2015.
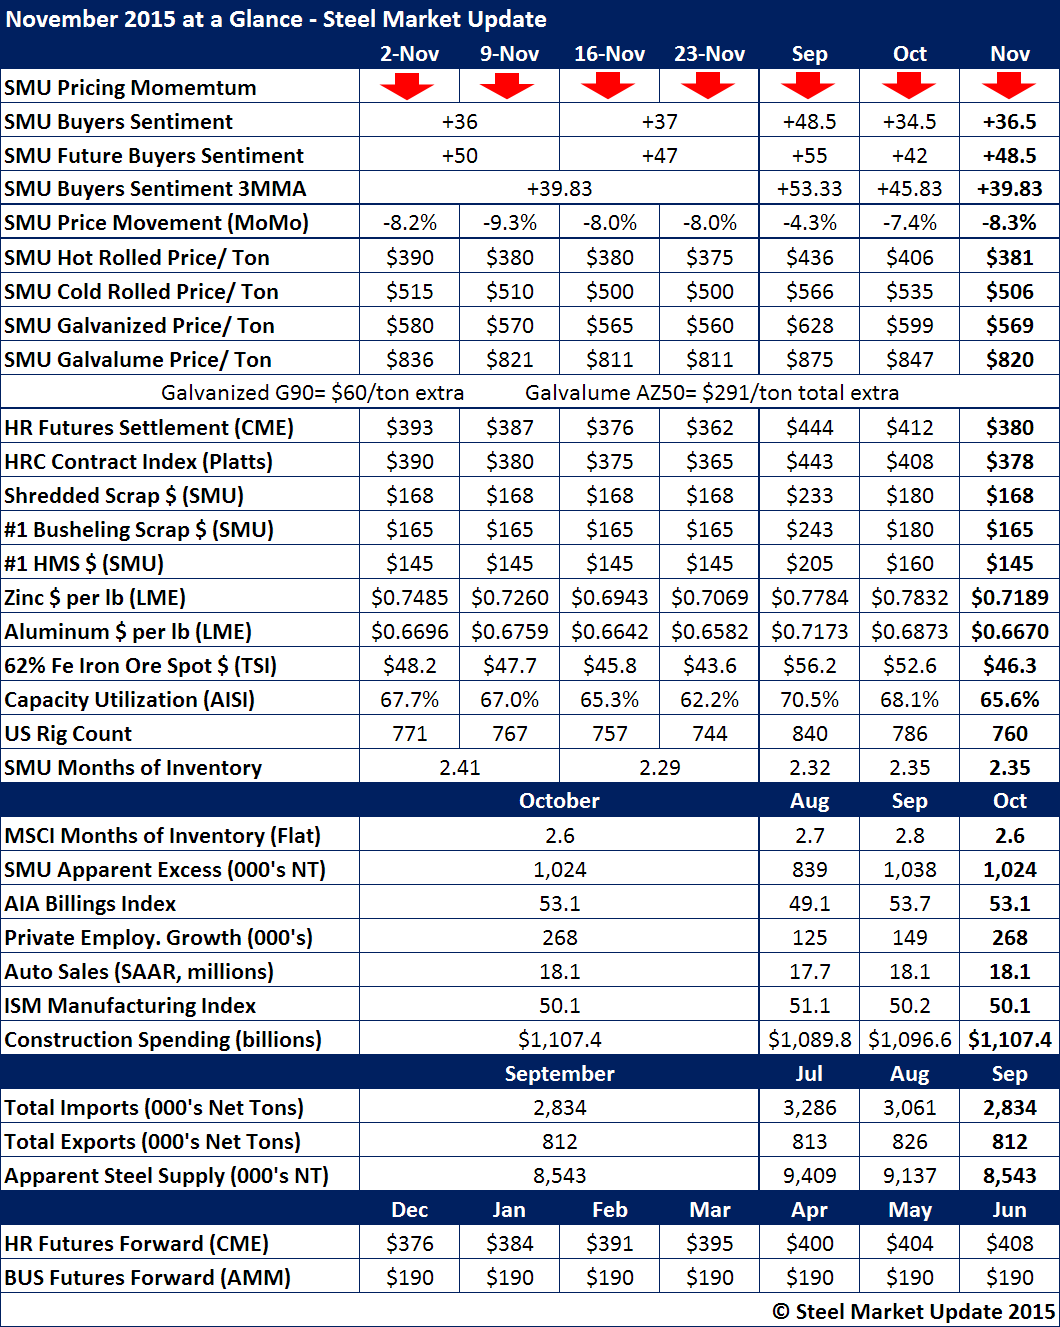
November benchmark hot rolled prices (SMU average) Dropped $15 per ton during the course of the month and are now down $310 per ton from the market cycle peak achieved on May 13, 2015 at $685 per ton.
The extended drop in prices can be attributed to a number of factors many of which are spelled out in the table shown below:
• Scrap prices were down an average of $15 per gross ton (some market more, east coast was less).
• Iron ore spot prices in China dropped $6.70/dmt on 62% Fe fines since the end of October until the last day of November.
• Domestic (USA) steel mill capacity utilization rates dropped during the month ending last week at 62.2%.
• SMU service center Apparent Excess flat rolled inventories continues to be above 1 million tons. However, Apparent Excess was forecast to reach 1.2 million tons so the number is a net positive as it is going in the right direction (Apparent Excess is a Premium product).
• Imports were down but were still well above the 22-24 percent of total apparent steel supply.
SMU Sentiment Index 3 month moving average (3MMA) has been steadily becoming less optimistic having gone from +53.33 in September to +39.83 during November.
The HRC Futures markets are not painting a rosy picture for the next seven months as they have HRC prices moving up to $408 per ton by the month of June.