

Prices

January 11, 2016
Detailed Import Report for Other Metallic Coated Sheet by Port of Entry and Country of Origin
Written by Peter Wright
SMU has developed a series of reports that cover hot rolled, cold rolled, HDG, other metallic coated, coiled plate and semi-finished slabs. These reports are a detailed drill down into tons by source country and port of entry which will enable you to determine exactly what is going on in your area for whichever product you are most interested in.
Each month we present one of these products as an example of what is available on our website. Product reports can be found by clicking on the Analysis tab in the SMU website and then going to the Import/Export Data section. At the bottom of that list will be our Imports by Port/Country (P) (The “P” next to the heading means it is for Premium level subscribers). Reports for the other products listed above are in a computer generated format and a bit less comprehendible than we present here, but any subscriber wanting this fine level of detail can find it as described above. Half-truths (not to mention outright misleading statements) about import volume and source float around the industry on a continuous basis. Our intent is to shine a light on exactly what is going on in a subscriber’s neighborhood. All volumes are in short tons.
This month we are using other metallic coated sheet (mainly Galvalume) as our example.
Figure 1 shows the long term picture of coated product imports since January 2011.
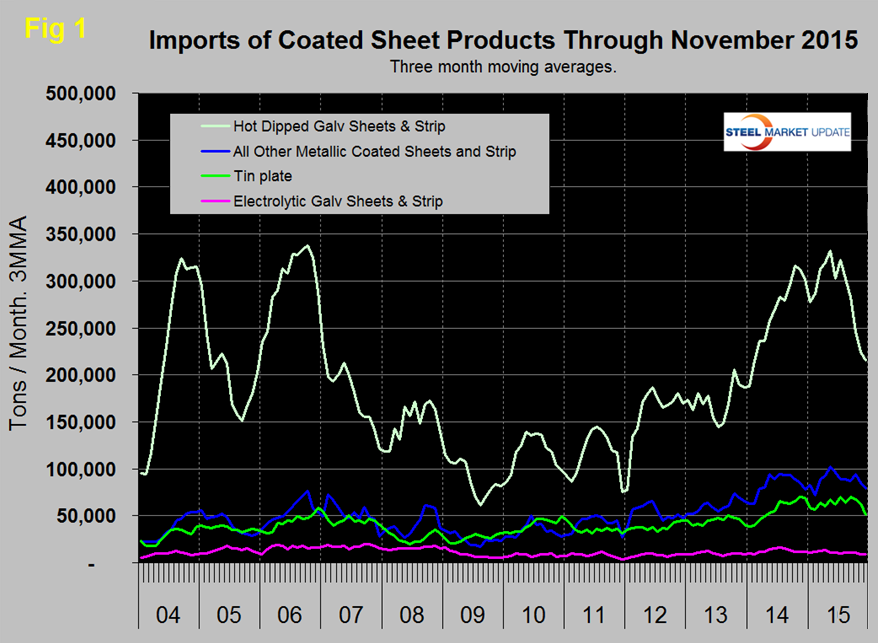
Table 1 shrinks the time comparison to one year and shows that total imports of OMC sheet in three months through December licenses were up by 1.3 percent compared to the same period in 2014.
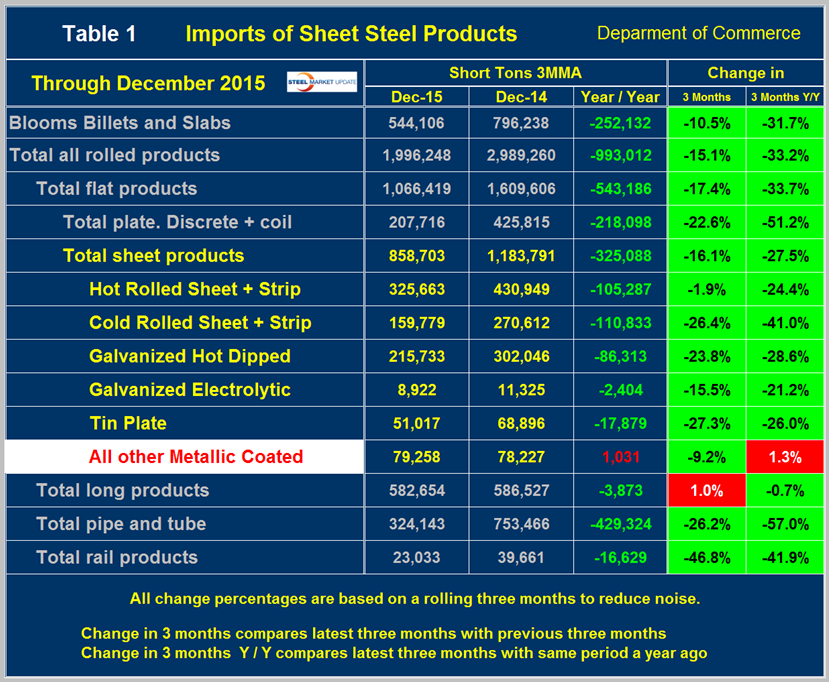
Comparing three months through December with three months through September, imports were down by 9.2 percent
All the following data in this report is final through November.
Table 2 drills down to tons by country and subtotaled by global source region by month for the first 11 months of 2015.
Note that you can click on the images to see a larger copy of them.
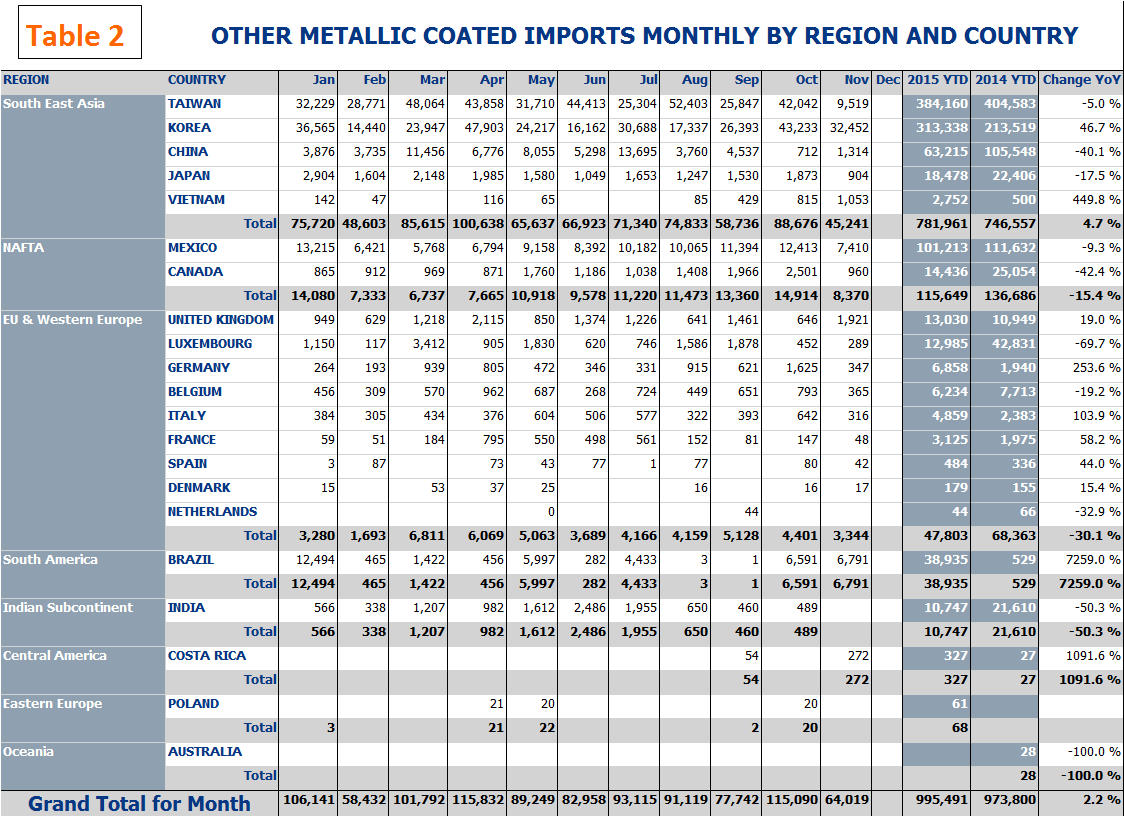
South East Asia had the highest regional total with Taiwan and Korea being by far the most prolific sources within that region. Tonnage from SE Asia was up by 4.7 percent YTD and from NAFTA, the second largest source was down by 15.4 percent. Figure 2 shows the YTD tonnage by country compared to the same period in 2014 and the final total for 2014 for comparison.
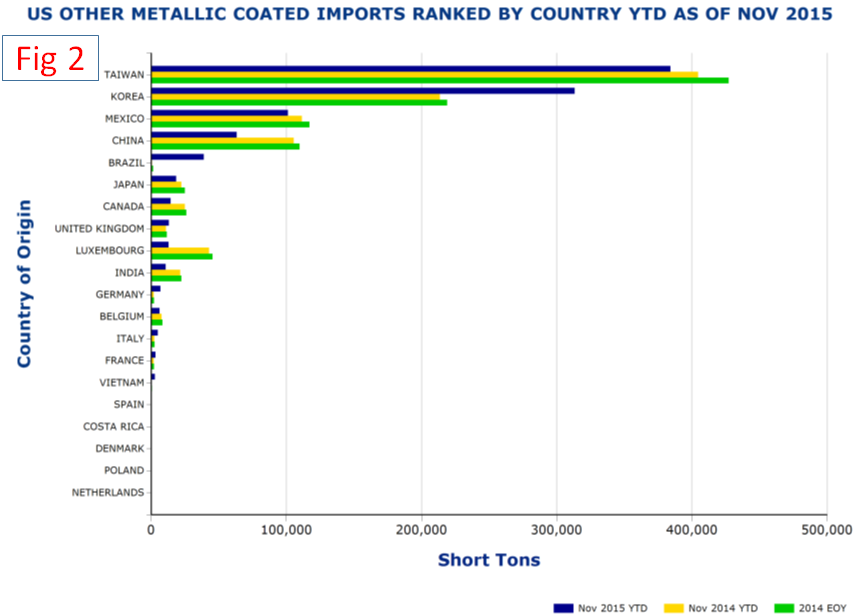
Korea has had the largest proportional increase this year, up by 46.7 percent as China was down by 40.1 percent
Table 3 shows the monthly tonnage by port of entry this year with sub-totals by US geographical region.
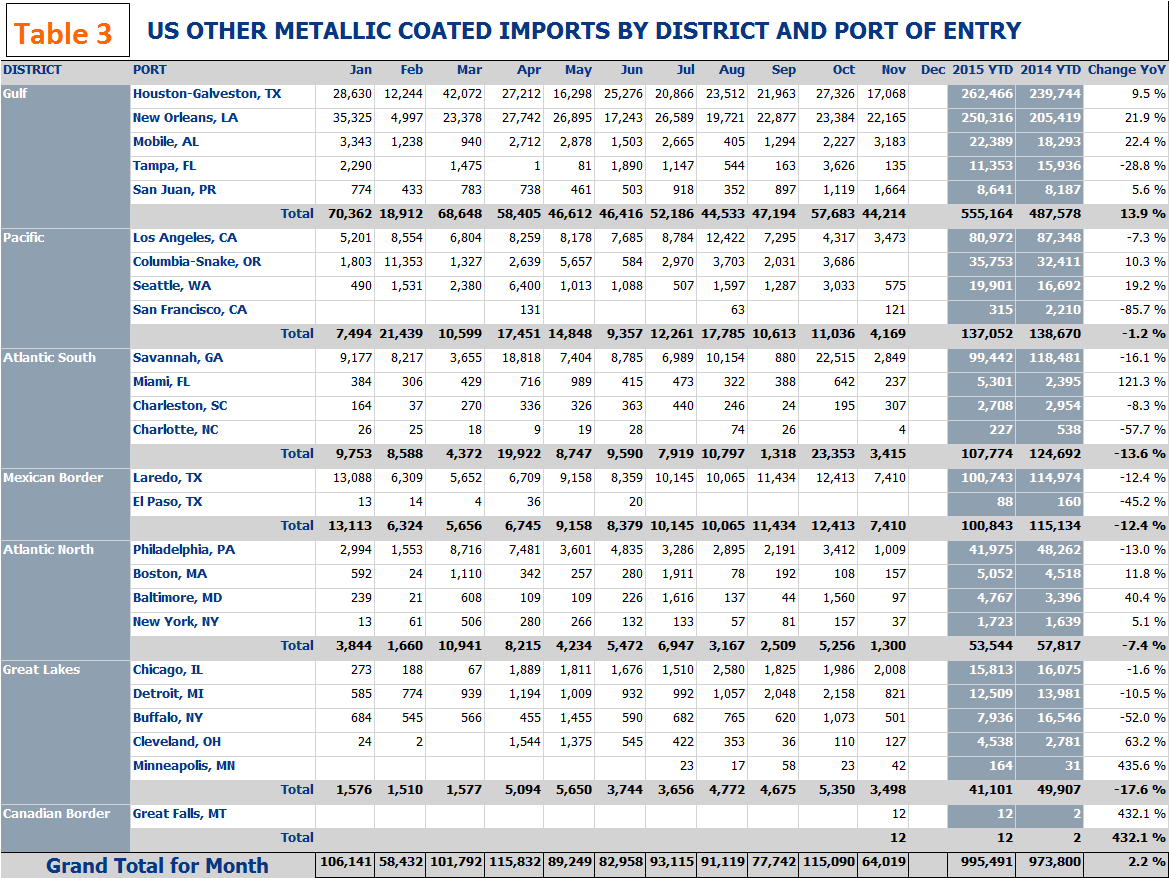
The Gulf region received the most tonnage YTD with Houston and New Orleans being the most popular port of entry. The Gulf has had an increase in tonnage YTD, all other regions are down. Please examine the table for your own region of interest.
Figure 3 shows tons by port YTD 2015 and for the same period in 2014 and the final total for 2014 by country for comparison.
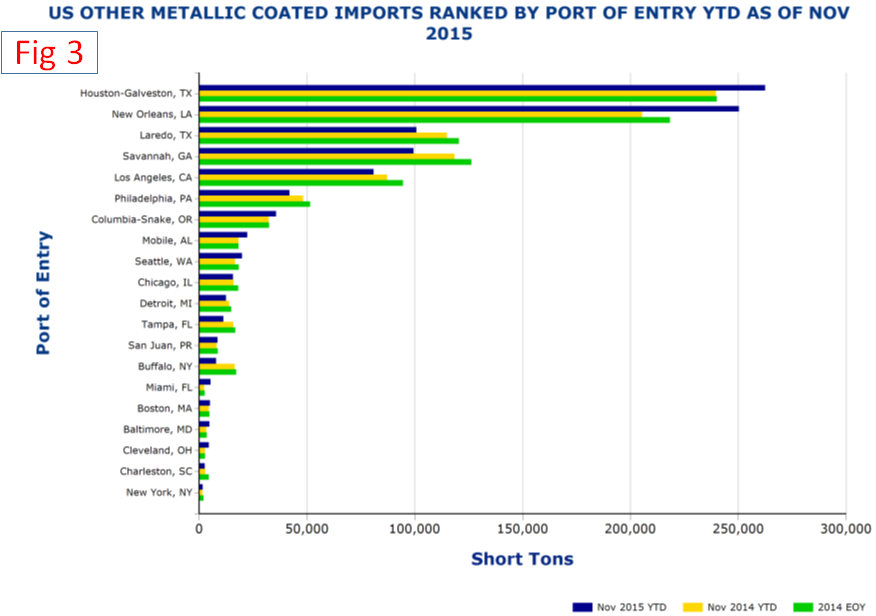
The tonnage through Houston and New Orleans this year through November exceeds the total for all of 2014 through those ports.
Table 4 puts it all together by showing the total tons that came into a port or region broken down into the source country for the first eleven months of 2015.
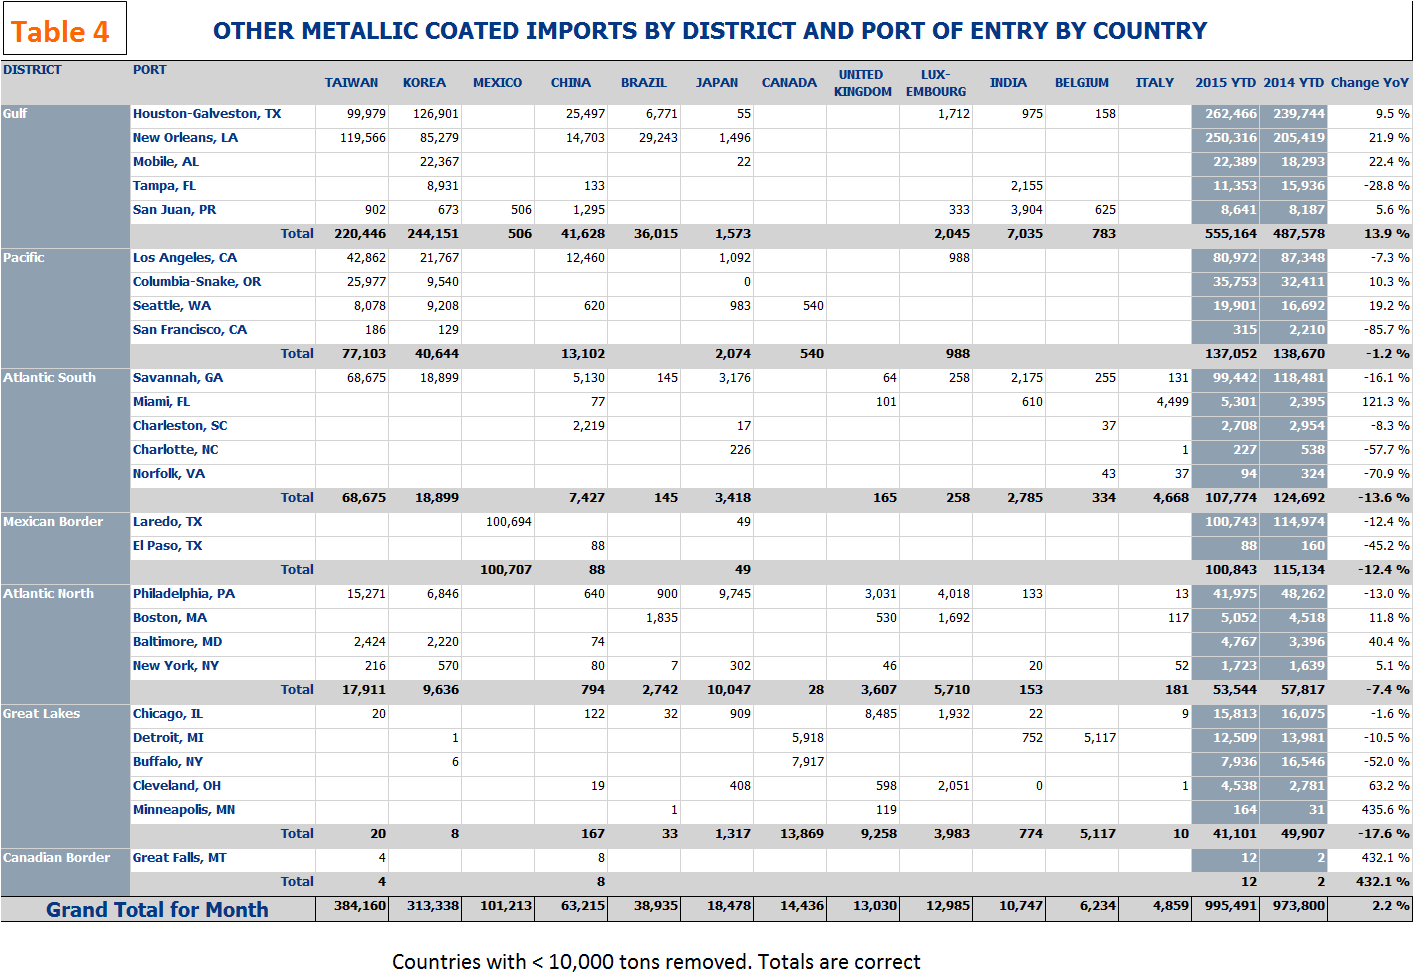
Countries with <10,000 tons this year and ports with minimal tonnage have been removed from this table to make it more comprehendible but the totals are all correct.
Suggestions on how to read this chart are as follows: If Los Angeles happens to be your nearest port of entry you can see that 80,972 tons came into your area this year which was down by 7.3 percent from last year through November. Over half of this tonnage came in from Taiwan. If you happen to be interested in where a certain countries volume was entering the US we can use Korea as an example. The bulk of their material came in through the Gulf ports presumably through the Panama Canal.


