

Market Data

February 3, 2016
Key Market Indicators - February 2, 2016
Written by Peter Wright
An explanation of the Key Indicators concept is given at the end of this piece for those readers who are unfamiliar with it.
![]() The total number of indicators considered in this analysis is currently 36.
The total number of indicators considered in this analysis is currently 36.
Please refer to Table 1 for the view of the present situation and the quantitative measure of trends.
Readers should regard the color codes in the present situation column as a quick look at the current market condition. The “Trend” columns of Table 1, are also color coded to give a quick visual appreciation of the direction in which the market is headed. All data included in this table was released in January through February 1st, the month or specific date to which the data refers is shown in the second column from the far right and all data is the latest available as of February 2nd.
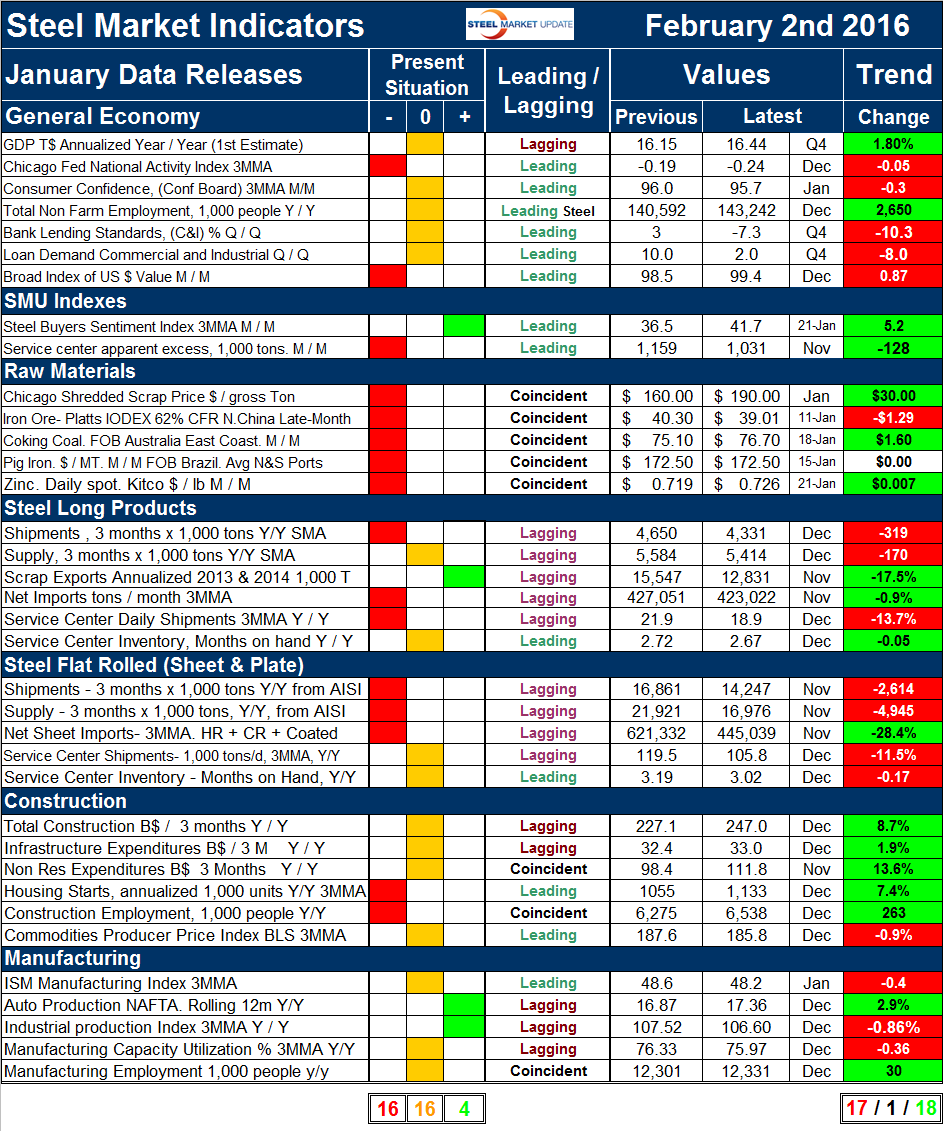
Present Situation
There was an increase of four negatives since we last published this review on December 31st, and a decrease of four in what we consider to be normal or neutral. We currently regard 4 of the 36 indicators to be positive, 16 to be neutral and 16 to be negative on a historical basis. Changes in the last month were as follows; the Chicago Fed National Activity Index (CFNAI) fell below negative 0.2 which is our normal to poor threshold. Shipments of long products changed from neutral to historically weak. Both shipments and supply of flat rolled changed from neutral to historically weak. There were no changes to the present situation of construction and manufacturing indicators. Figure 1 shows the change in our assessment of the present situation since January 2010 on a percentage basis.
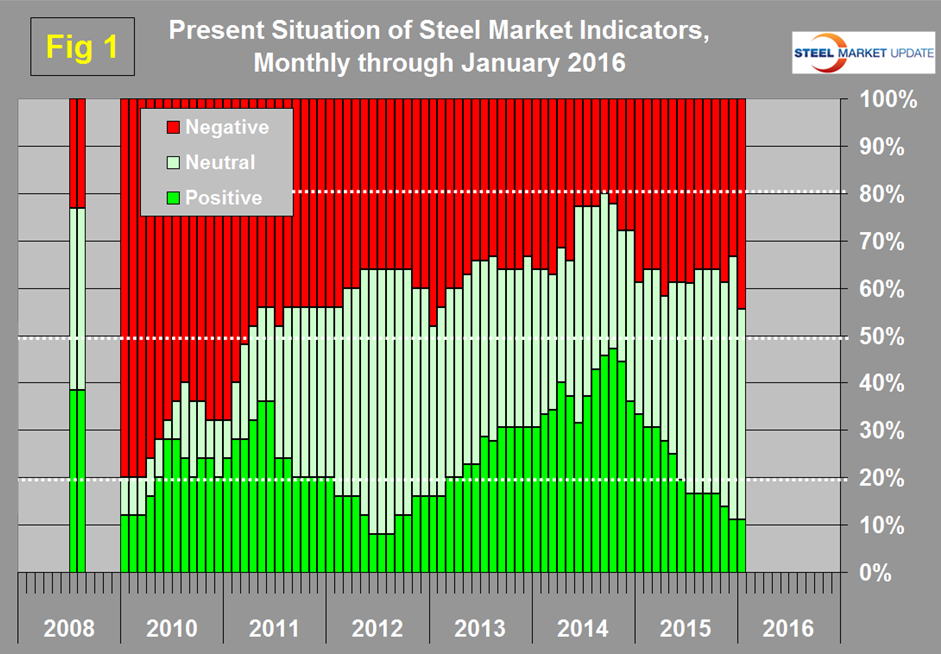
The number of indicators classified as positive peaked at 17 in October last year and has steadily declined to the present value of 4 which is 11.1 percent. There has not been much change in the number of indicators that we consider to be historically negative since the beginning of 2015, what has happened is that the decline in the positive indicators has occurred as a shift to neutral. The present situation of the general economy with the exception of the value of the US $ and the CFNAI is OK. Not great and not unsatisfactory by historical standards. We still regard the proprietary SMU steel buyer’s index as positive and the service center excess as negative. All the raw materials prices currently have a negative present situation. The present situation of the long products market is about the same as for flat rolled, longs supply is better but their service center shipments are worse. In our analysis here, shipments and supply are based on SMA data for long products and AISI for flat products. SMA gets their data out faster than AISI and longs data is for December and flats for November. In summary a quick visual appraisal of the present situation shows that the general economy is basically neutral. Steelmaking raw materials are historically weak through January’s data. Both steel sectors are neutral to weak. Construction continues to be weak to neutral and manufacturing continues to be neutral to strong. No indicators are currently rated positive in the construction category. None of the manufacturing indicators on a present situation basis are currently negative.
Trends
The number of indicators trending positive through February 2nd was 18 with 17 trending negative and one unchanged. This was an increase of two positive and a decrease of two negative since our December 31st update. Most values in the trends columns are three month moving averages (3MMA) to smooth out what can be very erratic monthly data. Figure 2 shows the trend of the trends.
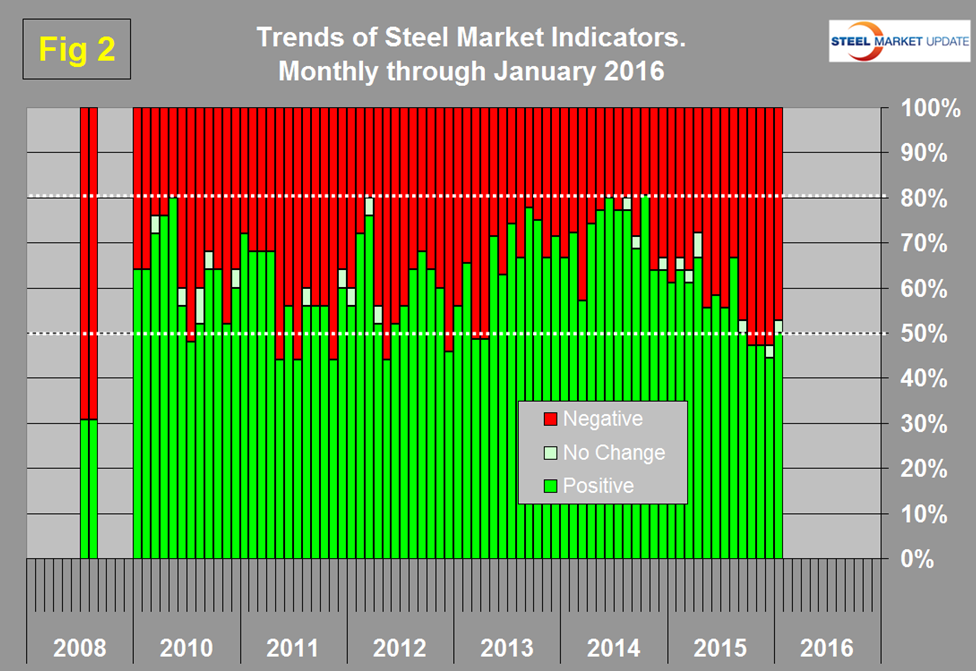
There has been a steady deterioration since the middle of 2014. At the end of 2015 the proportion trending positive fell below 50 percent for the first time since March and April 2013 but there was a small recovery in January. In October last year the proportion trending positive was 80.6 percent which coincided with the highest month of total steel supply since the recession. Figure 2 shows the pre-recession situation at the far left of the chart. In August 2008 over 2/3 (69.2 percent) of our indicators were trending negative and the steel market crashed in September of that year.
Changes in the individual sectors are described below. Please note in most cases this is not January data but data that was released in January through February 1st for previous months.
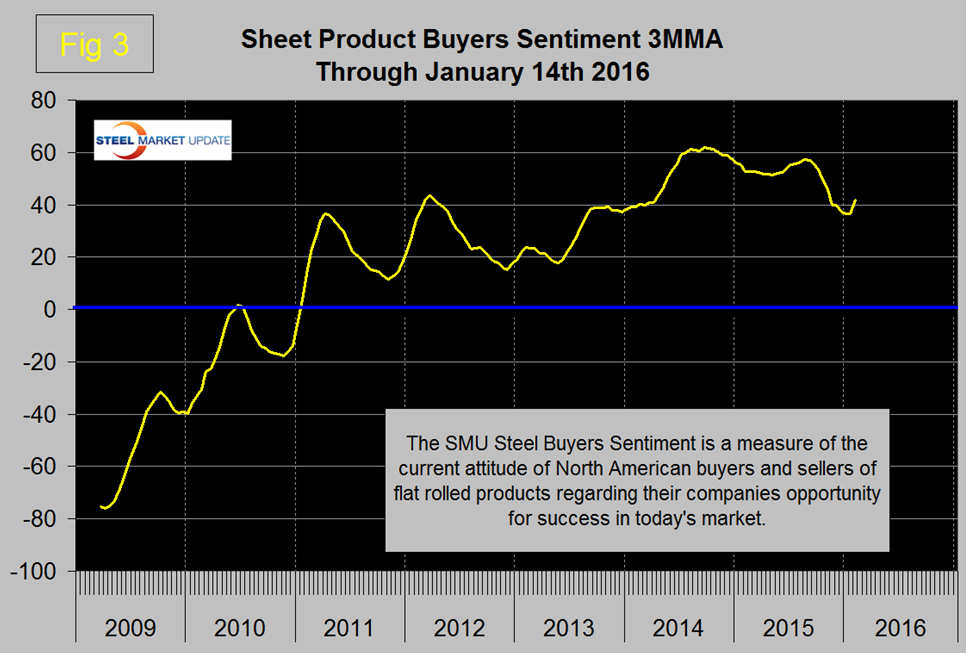
There was no change to the direction of trends in the general economy. Both the Steel Market Update proprietary indices reversed direction and trended positive. The SMU buyer’s sentiment index improved from 36.5 in mid-December to 41.7 in Mid-January as shown in Figure 3 and continues to be at a historical good level.
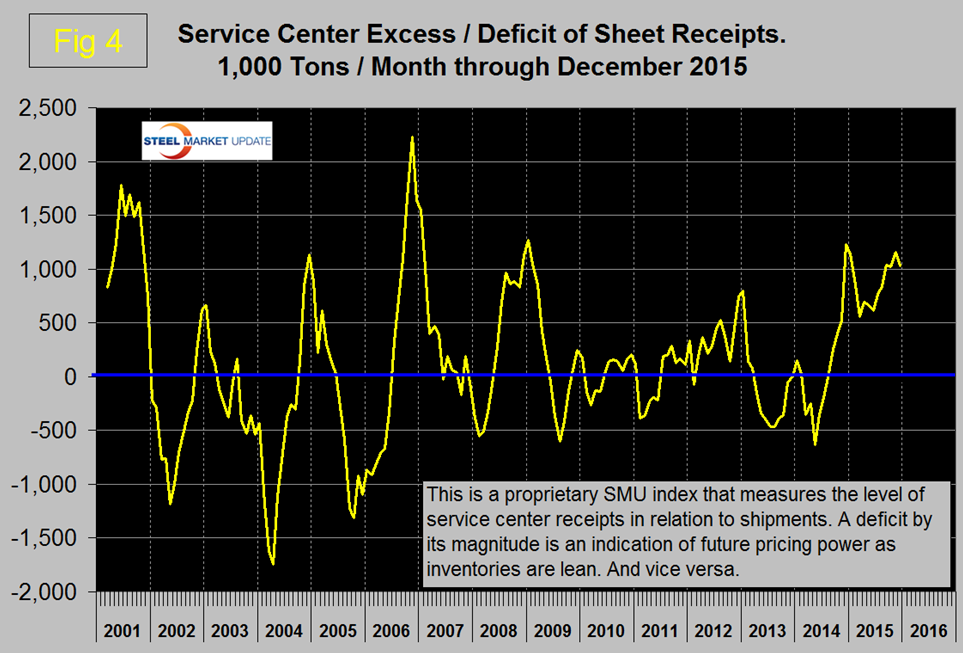
The calculation of service center excess inventory of sheet products which had trended positive in the October data trended negative in November then returned to slightly positive in December. This excess is very high by historical standards which we regard as a leading indicator of weak pricing power (Figure 4).
There were two changes in raw materials price trends in January. Chicago shredded picked up $30/ton to $190 which we regard as overpriced and due for a correction. The price of iron ore continued to trend negative and coking coal continued to trend positive. The price of pig iron out of Brazil which had trended positive in December was unchanged in January. The price of zinc continued to edge up slightly. In the long product section, there were no trend reversals in the data released in January. In the data released in December, all five indicators of the flat rolled sector trended negative but in the January data net imports enjoyed a strong reversal and contracted by 28.4 percent on a 3MMA basis. There was no change in direction of trends of the construction sector, five of the six indicators are trending positive. Manufacturing had an increase of one negative trend. This was in manufacturing capacity utilization which contracted by 0.36 percent year over year following two months of improvement.
We believe a continued examination of both the present situation and direction is a valuable tool for corporate business planning.
Explanation: The point of this analysis is to give both a quick visual appreciation of the market situation and a detailed description for those who want to dig deeper. It describes where we are now and the direction in which the market is headed and is designed to give a snapshot of the market on a specific date. The chart is stacked vertically to separate the primary indicators of the general economy, of proprietary Steel Market Update indices, of raw material prices, of both flat rolled and long product market indicators and finally of construction and manufacturing indicators. The indicators are classified as leading, coincident or lagging as shown in the third column.
Columns in the chart are designed to differentiate between where the market is today and the direction in which it is headed. Our evaluation of the present situation is subjectively based on our opinion of the historical value of each indicator. There is nothing subjective about the trends section which provides the latest facts available on the date of publication. It is quite possible for the present situation to be predominantly red and trends to be predominantly green and vice versa depending on the overall situation and direction of the market. The present situation is sub-divided into, below the historical norm (-) (OK), and above the historical norm (+). The “Values” section of the chart is a quantitative definition of the market’s direction. In most cases values are three month moving averages to eliminate noise. In cases where seasonality is an issue, the evaluation of market direction is made on a year over year comparison to eliminate this effect. Where seasonality is not an issue concurrent periods are compared. The date of the latest data is identified in the third values column. Values will always be current as of the date of publication. Finally the far right column quantifies the trend as a percentage or numerical change with color code classification to indicate positive or negative direction.


