Market Data

May 19, 2016
Flat Rolled Mill Lead Times Continue to be Extended
Written by John Packard
On Monday of this week, Steel Market Update began canvassing the flat rolled steel market as part of our mid-May flat rolled steel market trends analysis. One of the areas we probe is that of mill lead times, the amount of time it takes to get an order produced for new orders placed this week. We compile the information which comes from both manufacturing companies as well as service centers and we publish the average for each product.
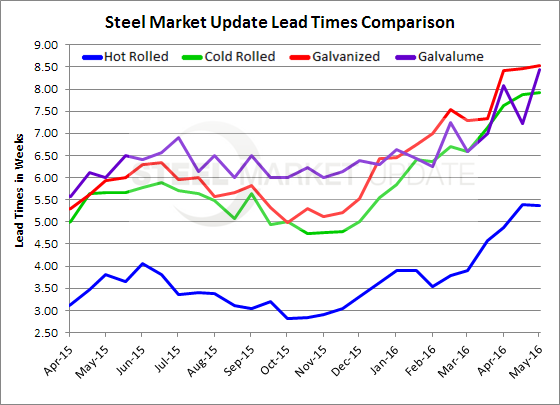
Our respondents continue to report extended mill lead times ranging from almost 5.5 weeks on hot rolled to 8.5 weeks on corrosion resistant products.
Hot rolled lead times were reported to be 5.36 weeks which is essentially unchanged from what we saw at the beginning of the month of May. At the beginning of April 2016 lead times were almost one week shorter (4.59 weeks). One year ago lead times were reported to average just under four weeks (3.81 weeks).
Cold rolled lead times are just about 8 weeks (7.92 weeks) according to our respondents. This is essentially unchanged from two weeks ago and, is about one week extended compared to the beginning of April. One year ago cold rolled lead times averaged 5.67 weeks or two weeks shorter than what we are reporting today.
Galvanized lead times continue to be 8.5 weeks (8.53 weeks) which is what we have reported over the previous two collection periods. At the beginning of April GI lead times averaged 7.33 weeks and one year ago they were reported as being 5.93 weeks.
Galvalume lead times were reported as being about one week longer at 8.44 weeks than what we measured two weeks ago (7.22 weeks). At the beginning of April we reported the AZ average to be 7.0 weeks and one year ago the average was 6.0 weeks.
We did some research and found we needed to go back to April 2014 in order to find average lead times on hot rolled, cold rolled and galvanized extended to the level we are seeing right now. Comparable Galvalume lead times were in early August 2014.
By the way, hot rolled prices in mid-April 2014 were $670 per ton, cold rolled was $788 per ton and galvanized was $798 per ton according to the SMU price indices. This week we reported hot rolled at $620 per ton, cold rolled at $820 per ton and galvanized at $815 per ton.
Lead times are an excellent barometer for measuring the strength of the market. At these averages the domestic mills are well positioned to keep supply tight and prices firm to moving higher.