Market Data

May 27, 2016
Service Centers Dramatically Reduce Apparent Inventory Excess & Our New Forecast
Written by John Packard
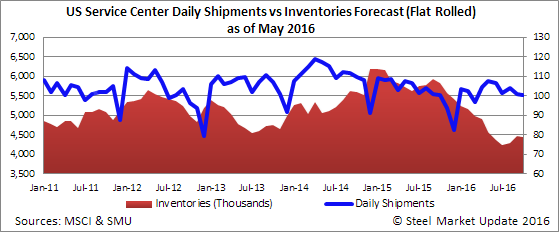
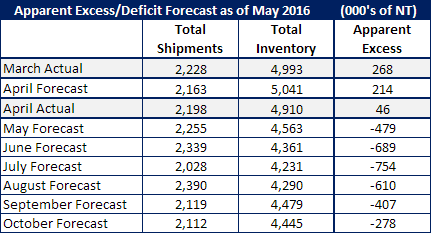
U.S. flat rolled steel service centers were able to reduce their excess inventories by 222,000 tons, according to our proprietary analysis of the MSCI data released earlier this month. Our Apparent Excess/Deficit model has the distributors carrying a 46,000 ton excess as of the end of April. This is the first time we have seen inventories close to “balanced” or a slight deficit since August 2014 when the distributors were carrying a deficit of 9,000 tons. Our expectation is for the service center carbon flat rolled inventories to continue to drop pushing into a deficit as early as the end of this month (May).
So, how did we do with our forecast for April?
Our original forecast called for April sheet shipments to total 2,163,000 or about the same as April 2015 levels of 103,000 tons per day. Actual shipments were 1.6 percent higher at 104,700 tons per day causing us to miss our forecast by +35,000 tons.
Our April forecast called for daily receipts to be 5 percent lower than the three year average making our forecast for 105,287 tons per day. The last couple of months have been averaging about 10 percent below the three year average. In actuality receipts came in at 13.4 percent below the three year average at 100,714 tons per day. Total inventories declined by 83,000 tons or 131,000 tons more than what we had forecast.
May Forecast
Our May forecast is based on total shipments of 2,255,000 tons. We believe receipts will remain constrained due to limited foreign and controlled order entry out of the domestic mills (which have been running at a fairly constant rate in the upper 80% level for sheet capacity utilization rates). Inventories should drop from 5.0 million tons to 4.563 million tons which would put the U.S. flat rolled steel service centers into a deficit for the first time since the summer 2014.
We have seen years where the service centers have been in a prolonged deficit situation (March-August 2014) just as we have seen distributors in an excessive inventories situation.
Price Forecast
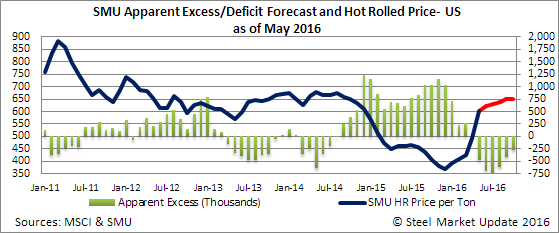
As one large service center put it to us recently, “For me, the big focus remains supply and that’s basically it. We need data (forecast or real) that shows when supply will exceed demand, in order to call a reversal. If the idled BF’s remain offline, this means prices can continue for a while. In recent discussions, I keep asking the question: tell me when supply moves higher than demand, and where does the increase in supply come from?”
Our forecast calls for HRC to reach $650 per ton over the next couple of months. Whether or not it will reach $700 per ton will depend on imports (where numbers are currently falling), demand (which will probably remain tepid for HRC), supply (will the mills restart any capacity) and service center inventories (for now we are forecasting they will not build inventories for awhile).