

Market Data

June 2, 2016
Steel Mill Lead Times Continue to be Extended
Written by John Packard
Flat rolled steel mill lead times continue to be extended according to those responding to this week’s steel market trends analysis (lead times are the amount of time it takes for an order placed today until the steel is produced and shipped out of the domestic steel mill). Lead times now average two weeks or more than what we saw at the beginning of June one year ago.
The lead times referenced below are not out of any specific mill but rather are a conglomeration of all of the data points collected from manufacturing companies and service centers/wholesalers during our early June flat rolled steel market trends analysis (survey). The result is an average industry lead time which could be shorter or longer than that of a specific mill. Our interest here is the trend and not the data from a specific mill (most mills are on controlled order entry right now).
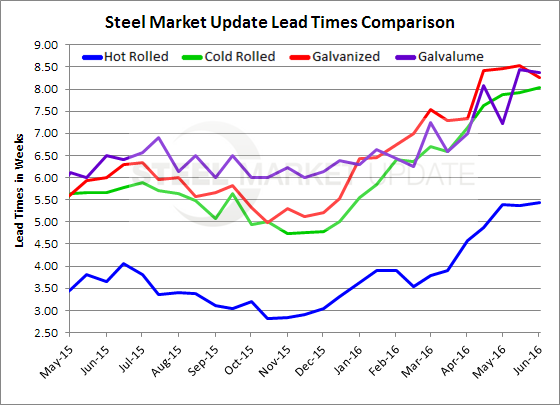
Hot rolled lead times remained about the same as what we have been seeing since the beginning of May at just shy five and a half weeks (5.43 weeks). One year ago HRC lead times averaged 3.66 weeks.
Cold rolled lead times have been slowly increasing and are now averaging 8 weeks (8.04) or about 2.5 weeks longer than one year ago (5.67 weeks).
Galvanized lead times are now averaging 8.25 weeks which is slightly shorter than the 8.5 weeks we have been reporting since the middle of April. Even so, this week’s average is 2.25 weeks longer than the 6.0 weeks reported one year ago.
Galvalume lead times continued at just shy 8.5 weeks (8.38 weeks) and are 1.75 weeks further extended than what we saw one year ago (6.50 weeks).
Extended lead times are an excellent indicator of the strength of the steel mills as they try to control the direction of flat rolled steel prices. Prices have been rising since early December 2015 and our lead time graphic clearly shows the change in lead times since then.
A side note: The data for both lead times and negotiations comes from only service center and manufacturer respondents. We do not include commentary from the steel mills, trading companies, or toll processors in this particular group of questions.
To see an interactive history of our Steel Mill Negotiations data, visit our website here.


