

Market Data

March 9, 2017
Steel Mill Lead Times: Essentially Unchanged from 2 Weeks Ago
Written by John Packard
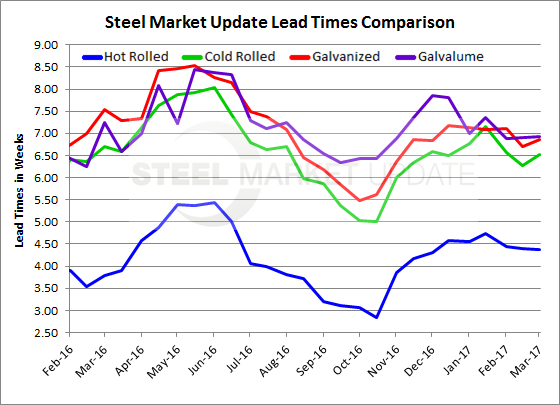
Hot rolled average lead times remain extended at 4.38 weeks compared to the 3.79 weeks SMU was reporting one year ago. Cold rolled, galvanized and Galvalume lead times were running close to or just below last year’s reported average.
Lead time is the average amount of time it takes for a new order of a product to be produced at a domestic steel mill. The lead time averages are based on the collective responses to our early March flat rolled steel survey made by manufacturers and service centers. The average lead time is not tied to any one mill and can vary so buyers need to be aware of the exact lead times being quoted on all products at each of the domestic mills by contacting their mill representative.
Hot rolled lead times continue to be slightly extended at almost 4.5 weeks. As mentioned at the beginning of this article the lead time average produced today is one half a week longer than what we reported one year ago.
Cold rolled lead times are averaging 6.5 weeks (6.53 weeks) and are just under the 6.71 weeks reported one year ago.
Galvanized lead times are just under 7 weeks (6.83 weeks) which is approximately one half a week shorter than one year ago.
Galvalume lead times were also just under 7 weeks (6.93 weeks) which is about one quarter a week shorter than one year ago.
A side note: The data for both lead times and negotiations comes from only service center and manufacturer respondents. We do not include commentary from the steel mills, trading companies, or toll processors in this particular group of questions.
To see an interactive history of our Steel Mill Negotiations data, visit our website here.


