

Market Data

October 19, 2017
Steel Mill Lead Times: Shortening
Written by Tim Triplett
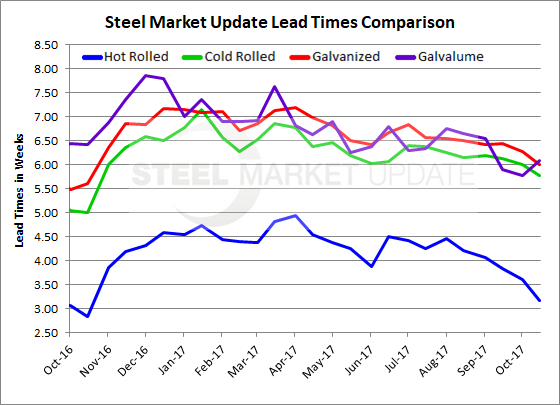
Flat rolled steel lead times continue to shorten up, a trend under way since early August, according to the service centers and manufacturers who responded to Steel Market Update’s flat rolled steel market trends questionnaire this week. On average, lead times have dipped to nearly three weeks for hot rolled, slightly less than six weeks for cold rolled, right at six weeks for galvanized and a bit over six weeks for Galvalume.
Lead time, which is the amount of time it takes for the domestic steel mills to produce a new order from the time the order was placed, is a rough indicator of the demand trend. The shorter the lead time, the less busy the mill and the weaker the demand. The current shortening lead times would appear to run contrary to recent steel mill price increase announcements.
As of Oct. 15, hot rolled lead times were reported to be averaging 3.16 weeks, down from 3.60 two weeks ago and 4.20 weeks two months ago. A year ago, they were averaging 2.84 weeks.
Cold rolled lead times are down to less than 6.0 weeks (5.77 weeks) from 6.13 weeks a month ago. The cold roll lead time is still nearly a week longer than at this time last year.
Galvanized lead times are averaging 6.0 weeks, down from 6.45 a month ago, but up from 5.61 a year ago.
Galvalume lead times are now averaging about six weeks (6.09 weeks), up from 5.78 weeks in early October, but still below the 6.43 weeks one year ago.
Note: These lead times are based on the average from manufacturers and steel service centers who participated in this week’s SMU market trends analysis. Our lead times do not predict what any individual may get from any specific mill supplier. Look to your mill rep for actual lead times. Our lead times are meant only to identify trends and changes in the marketplace. To see an interactive history of our Steel Mill Lead Times data, visit our website here.


