

Market Data

February 25, 2018
Domestic Mills Win Back Market Share from Imports in 2017
Written by Peter Wright
In 2017, the domestic steel market contracted by 0.5 percent, but domestic shipments were up while imports were down.
Table 1 shows 11 years of history of total steel supply to the U.S. market broken down into shipments from domestic mills and imports, excluding semi-finished. The hot rolled steel market totaled 106.4 million tons in 2017. Supply increased for five consecutive years 2010 through 2014, declined in 2015 and was relatively flat in 2016 and 2017. In 2017, imports excluding semis totaled 28.3 million tons.
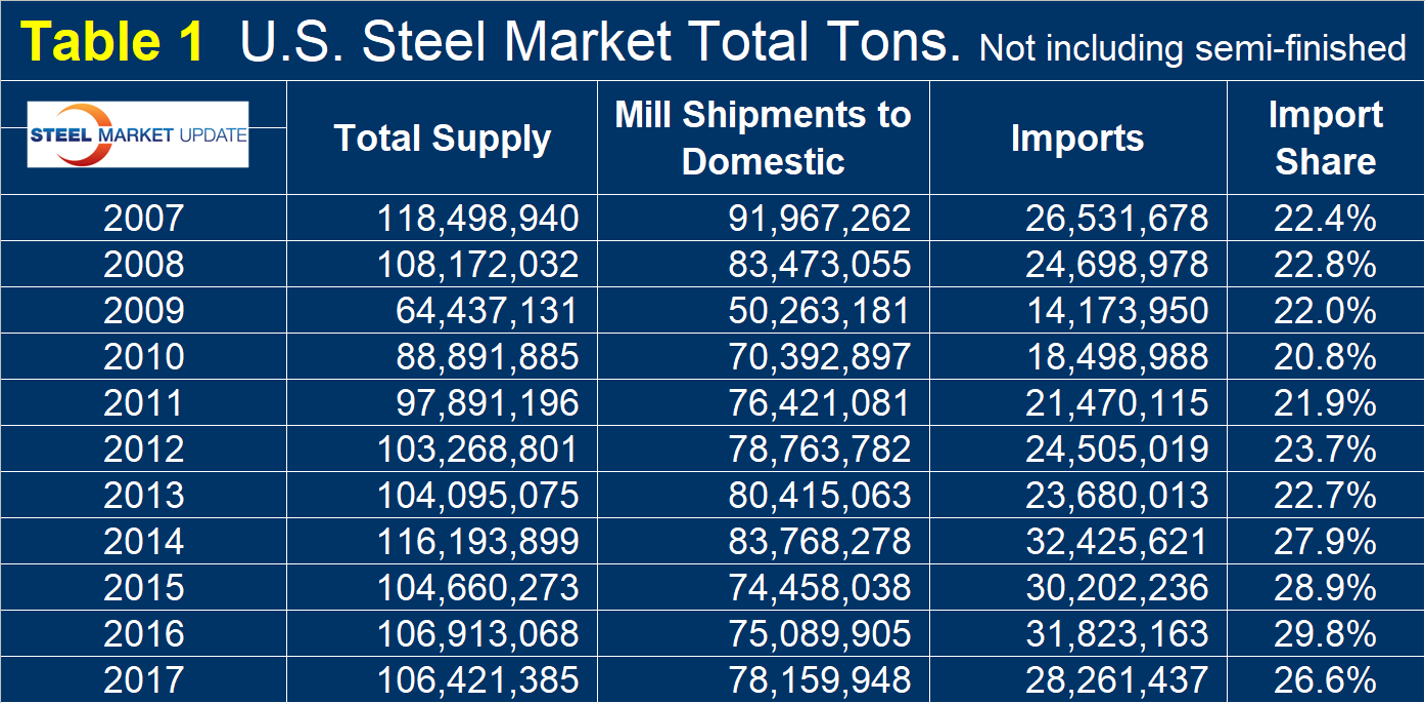
Table 2 shows the year-over-year change annually since 2006. In 2017, the total market was down 0.5 percent, but the domestic mills took share from imports. Compared to 2016, mill shipments to domestic locations were up by 4.1 percent while imports were down by 11.2 percent. This trend was particularly driven by long products, less so for sheet.
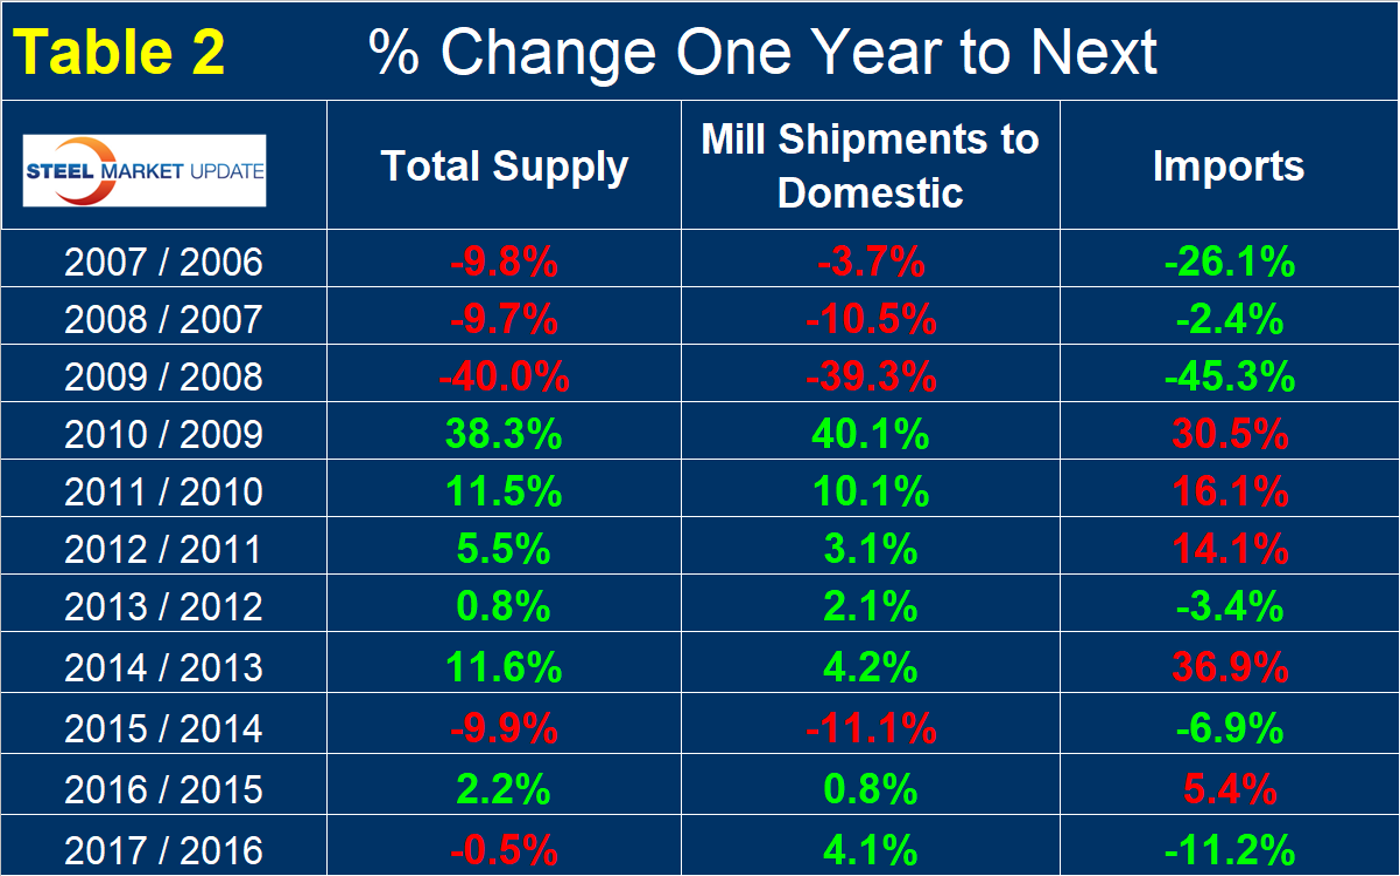
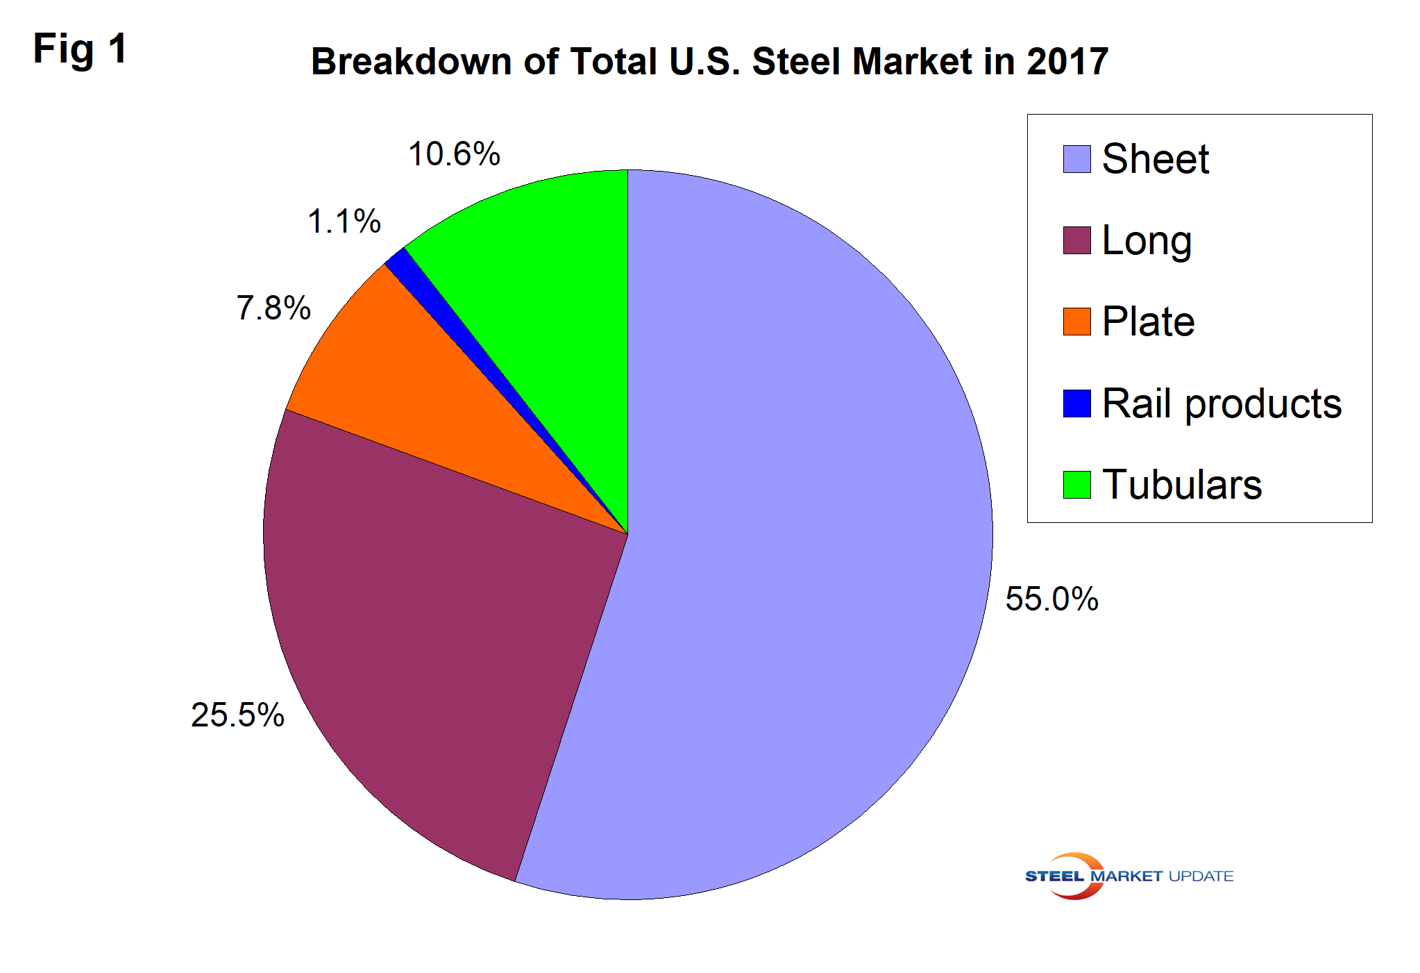
Figure 1 shows the relative size of the major sectors identified by the American Iron and Steel Institute and the U.S. International Trade Commission.
The three-month moving average of rolled product imports declined for each of the five months August through December, a period in which the market was anticipating possible Section 232 restrictions on foreign steel.


