

Market Data

March 8, 2018
Steel Mill Lead Times: Extend Even Further
Written by Tim Triplett
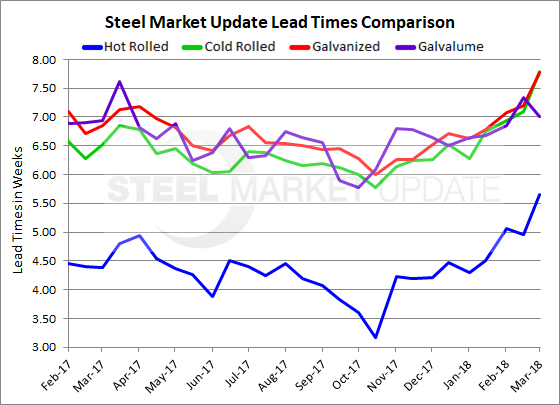
Mill lead times on flat rolled steel orders continue to extend as supplies tighten and buyers scramble to replenish inventories ahead of the next price increase. One of the key indicators tracked by Steel Market Update, lead times reflect the activity at the mills and the order levels they are seeing from their customers. About 30 percent of respondents to this week’s SMU market trends questionnaire report that lead times are highly extended, while an additional 42 percent call them slightly longer than usual. Another 27 percent consider lead times normal for this time period. None consider them shorter. SMU’s latest data indicates that the average lead time for hot rolled has grown to between five and six weeks, while cold rolled and galvanized are approaching eight weeks. The lone exception is the lead time for Galvalume, which shortened a bit to seven weeks.
Hot rolled lead times now average 5.65 weeks, up from 4.95 weeks in mid-February. Hot rolled lead times have extended by more than two weeks since steel prices began rising in October.
Cold-rolled lead times now average 7.79 weeks, up from 7.09 weeks just two weeks ago. Cold rolled lead times have not been this long since mid-June 2016.
Galvanized lead times have moved up to 7.78 weeks from 7.20 weeks in mid-February. Like with cold rolled, buyers have not had to wait this long for galvanized orders since mid-2016.
The lead time for Galvalume is now 7.00 weeks, down slightly from 7.33 weeks two weeks ago.
Note: These lead times are based on the average from manufacturers and steel service centers who participated in this week’s SMU market trends analysis. Our lead times do not predict what any individual may get from any specific mill supplier. Look to your mill rep for actual lead times. Our lead times are meant only to identify trends and changes in the marketplace. To see an interactive history of our Steel Mill Lead Times data, visit our website here.


