

Prices

March 12, 2018
Q&A on SMU Market Share Percentages
Written by Brett Linton
We received a question from one of our readers today asking for clarification on import market share as presented in different articles. We look at imports from both a macro view (total imports = percentage of apparent supply) as well as a more focused view (such as how large is the share of pipe and tube to the total pie?):
Question for you. I am looking at page 13 of the latest SMU. On the Apparent Steel Supply chart, it shows imports as 25.7 percent of apparent supply. However, on Page 4, the 3-month average shows imports are 17.1 percent of the total supply of all sheet products. How do I square these numbers? Were January imports that far above the 3-month average as a percentage of the total?
Brett Linton responded with this clarification:
The 25.7 percent figure on imports’ share of apparent supply takes into account all steel products (flat and long) for the month of January 2017. The Nov. 16 through Jan. 17 average is a little lower at 24.5 percent. November itself was 25.1 percent and December was 22.6 percent.
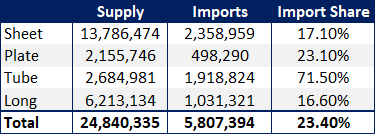
The 17.1 percent November-January average figure in the other article is just for flat products. If you add up the other products in that table, you get a 3-month average of 23.4 percent.
The numbers are slightly different because the reports use different data sources. I wrote the ‘January Apparent Steel Supply at 9.2 Million Tons’ article using pre-categorized trade data from the Department of Commerce and total shipment data from AISI. The author of the ‘New SMU Report Shows Imports Losing Market Share’ piece uses more detailed figures from the ITC and AISI to break the data down into those categories.
We welcome all comments and questions from our readers. You can reach our team at info@SteelMarketUpdate.com.


