

Market Data

March 16, 2018
BLS Data Shows Steel Doing Well vs. Competitive Materials
Written by Peter Wright
The competitive position of steel and steel products has improved in the last few months, according to Bureau of Labor Statistics (BLS) data.
In the past, we have reported the producer price indexes of steel and some competing products on a quarterly basis. This month, we have revamped and expanded our report to provide subscribers with a much wider view of sheet steel, aluminum, plastic and downstream products such as beverage cans, metal buildings and pipe, along with a comparison of truck and rail transportation. We think this expanded analysis will be timely as the downstream effects of the Section 232 legislation become apparent.
On Tuesday, the BLS released its series of producer price indexes (PPIs) for more than 10,000 goods and materials through February. For an explanation of this program, see the end of this piece. This SMU report is intended to inform subscribers of changes in the competitive position of steel and steel products, and rail vs. truck transportation. The PPI data are helpful in monitoring price direction, though there may be a lag between the BLS reports and spot prices for steel products. The actual index values of the PPIs of different products cannot be compared with one another because they are developed by different committees within the BLS. We believe this data is useful in comparing the direction of prices in the short and medium term, but not the absolute value.
The headline summary from the BLS was as follows: “The Producer Price Index for final demand rose 0.2 percent in February, as prices for final demand services advanced 0.3 percent, and the index for final demand goods edged down 0.1 percent. The final demand index increased 2.8 percent for the 12 months ended in February.”
Figure 1 shows the composite PPI of all commodities since January 2008. The index has risen steadily for two years but is still not back to where it was in the years 2011 through 2014.
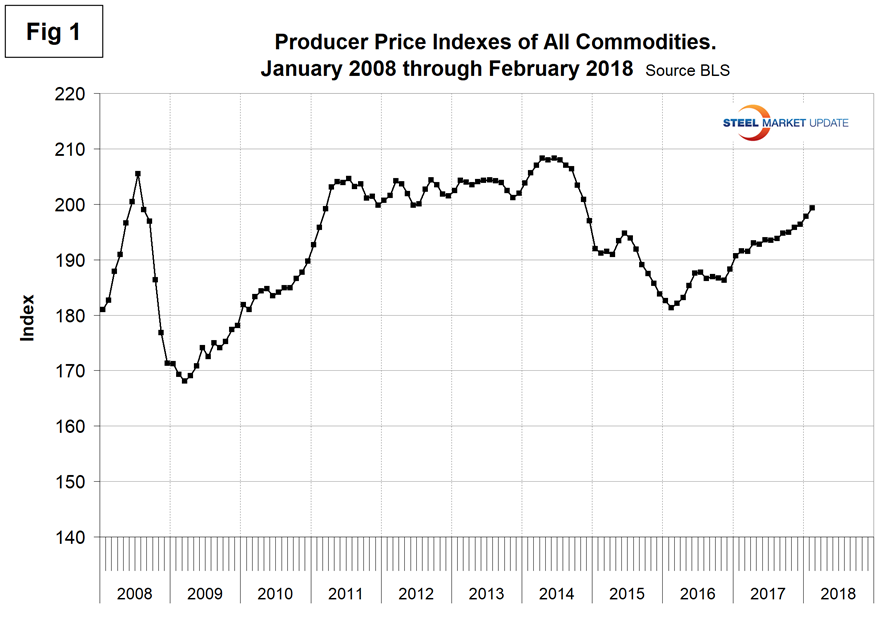
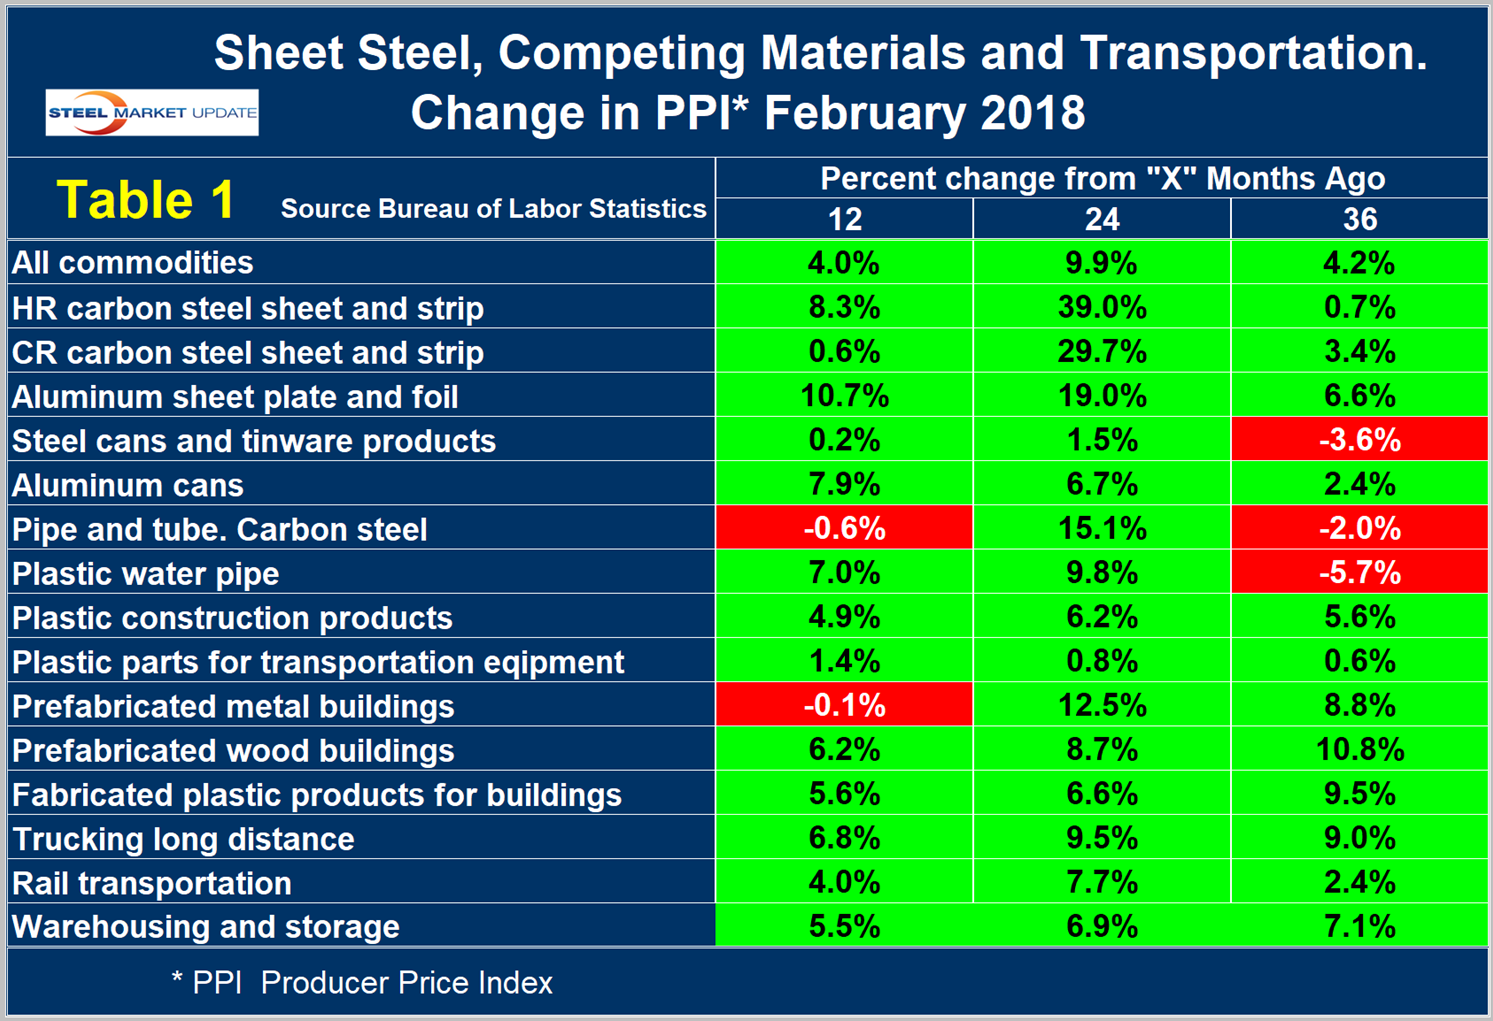
Table 1 is a summary of each category on a year over one-, two- and three-year basis. The gain/loss pattern is shown by the color codes; we interpret rising prices as positive. This table includes some other plastic products for which there is no direct steel comparison and a measure of price changes for warehousing and storage.
Some specific comparisons of steel and steel products with their competition are as follows. Please note the Y axis scales are not the same.
Figure 2 shows the year-over-year comparison of the price change of cold rolled steel sheet and flat rolled aluminum. Steel lost ground to aluminum from mid-2016 through mid-2017 but has made up some ground since then.
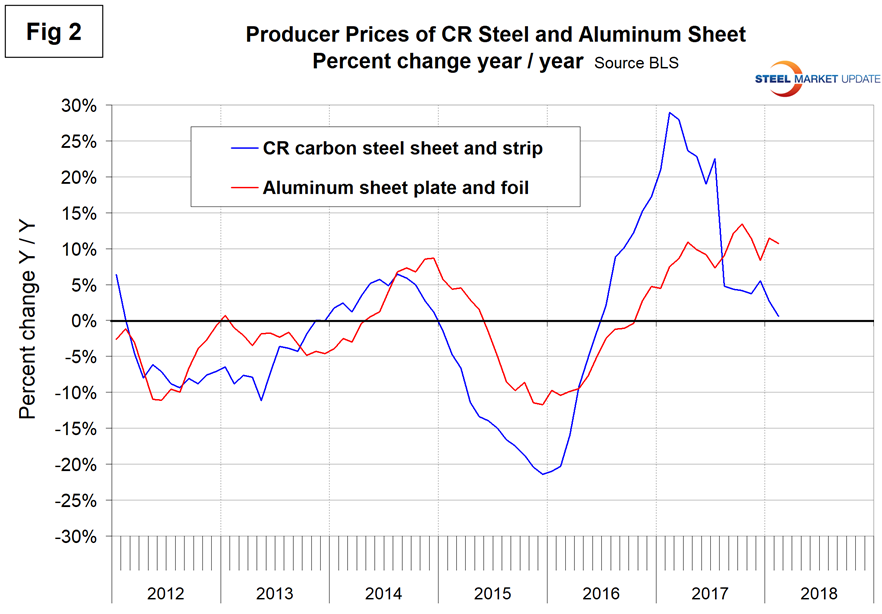
Figure 3 shows the same comparison for steel and aluminum beverage cans. Steel has become increasingly competitive in the last five months.
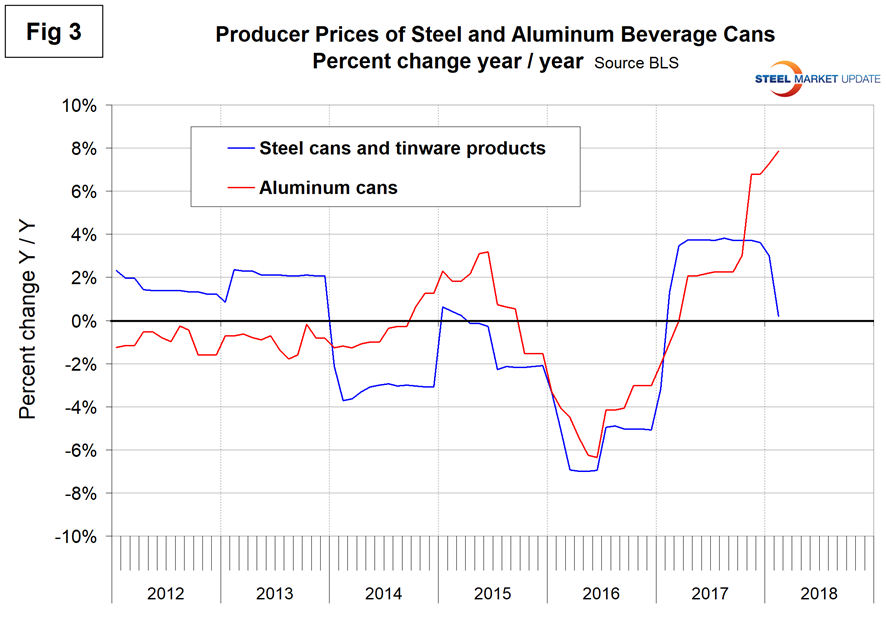
Figure 4 compares prefabricated metal with prefabricated wood buildings. Metal buildings have become increasingly competitive since mid-2017.
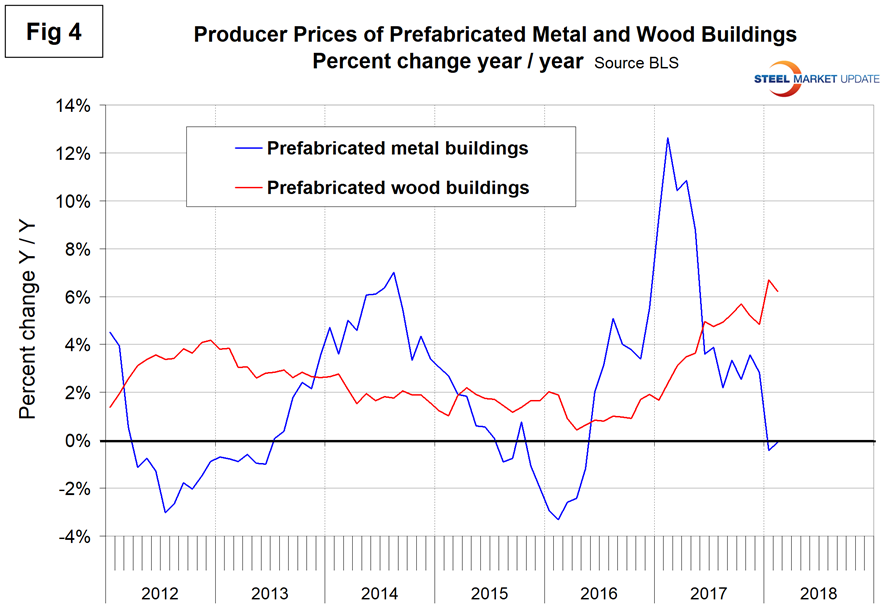
Figure 5 compares steel and plastic pipe. After losing ground in most of 2017, steel has made up some ground in the last three months.
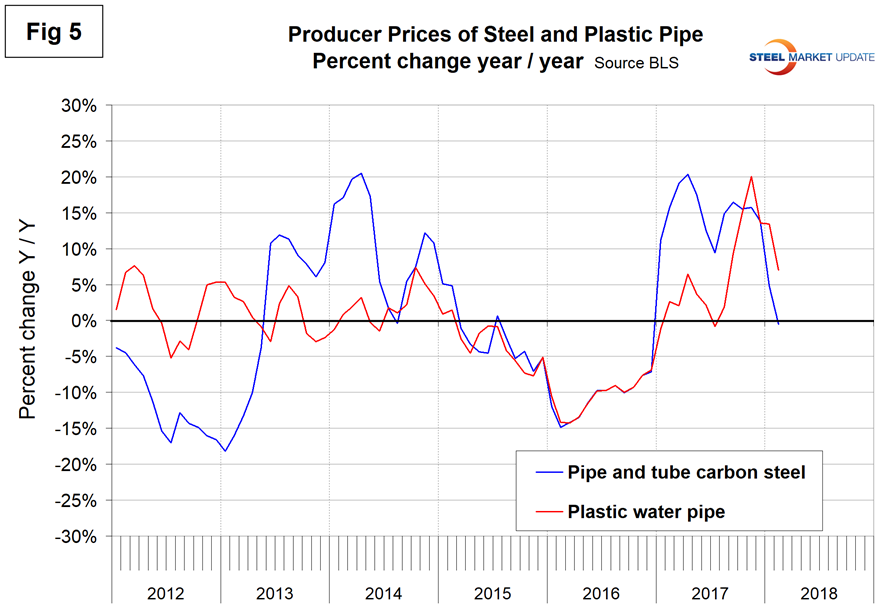
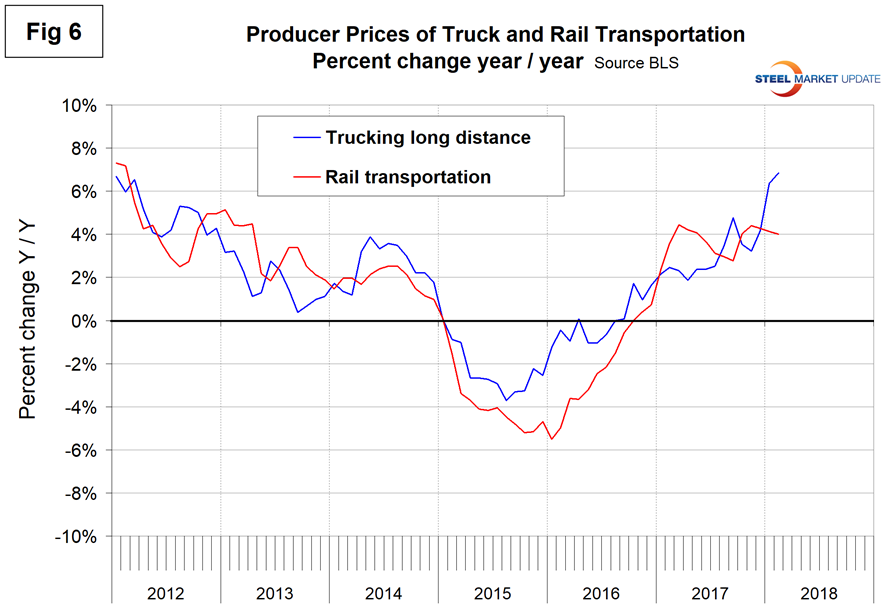
Figure 6 compares the changes in the price of truck and rail transportation. Trucking costs have outpaced rail in the last two months.
The official description of this program from the BLS reads as follows: “The Producer Price Index (PPI) is a family of indexes that measure the average change over time in the prices received by domestic producers of goods and services. PPIs measure price change from the perspective of the seller. This contrasts with other measures, such as the Consumer Price Index (CPI). CPIs measure price change from the purchaser’s perspective. Sellers’ and purchasers’ prices can differ due to government subsidies, sales and excise taxes, and distribution costs. More than 10,000 PPIs for individual products and groups of products are released each month. PPIs are available for the products of virtually every industry in the mining and manufacturing sectors of the U.S. economy. New PPIs are gradually being introduced for the products of industries in the construction, trade, finance, and services sectors of the economy. More than 100,000 price quotations per month are organized into three sets of PPIs: (1) stage-of-processing indexes, (2) commodity indexes, and (3) indexes for the net output of industries and their products. The stage-of processing structure organizes products by class of buyer and degree of fabrication. The commodity structure organizes products by similarity of end use or material composition. The entire output of various industries is sampled to derive price indexes for the net output of industries and their products.


