

Market Data

April 2, 2018
Consumer Confidence Retreats in March
Written by Peter Wright
Consumer confidence dipped slightly in March, but the three-month moving average continued to advance, according to The Conference Board’s Consumer Confidence Survey. The composite value of consumer confidence in February was 127.7, down from 130.0 in February. The three-month moving average (3MMA) increased from 125.8 in February to 127.3 in March, which was 9.8 points higher than in March last year. Consumer confidence is a driver of consumer spending, which is the largest component of GDP and ultimately drives a large portion of steel consumption.
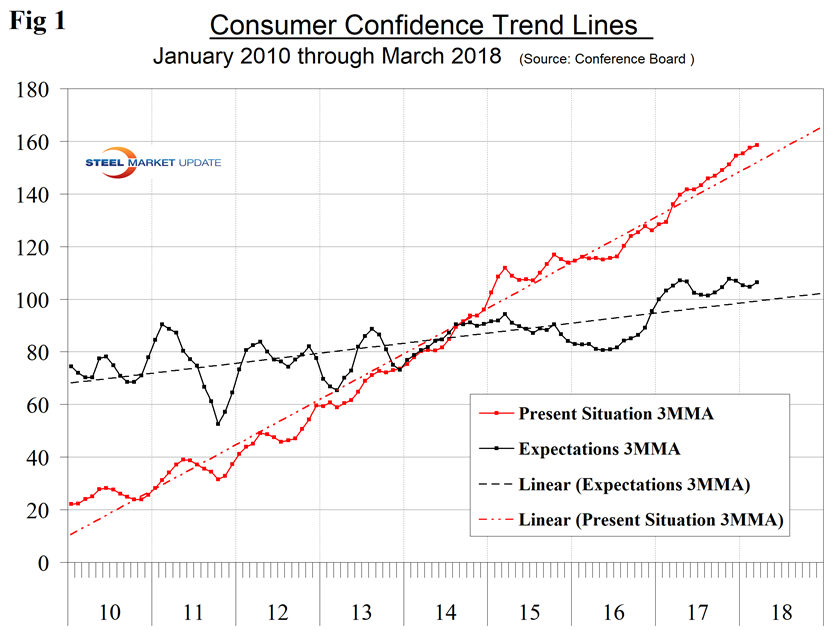
In March, the 3MMA of the composite increased by 1.53 points to 127.3 points. We prefer to smooth the data with a moving average because of monthly volatility, which in the case of consumer confidence has been quite extreme since the beginning of 2016. The composite index is made up of two sub-indexes. These are the consumer’s view of the present situation and his or her expectations for the future. Both are now above their nine-year trend line (Figure 1).
The historical pattern of the 3MMA of the composite, the view of the present situation and expectations since January 1990 are shown in Figure 2.
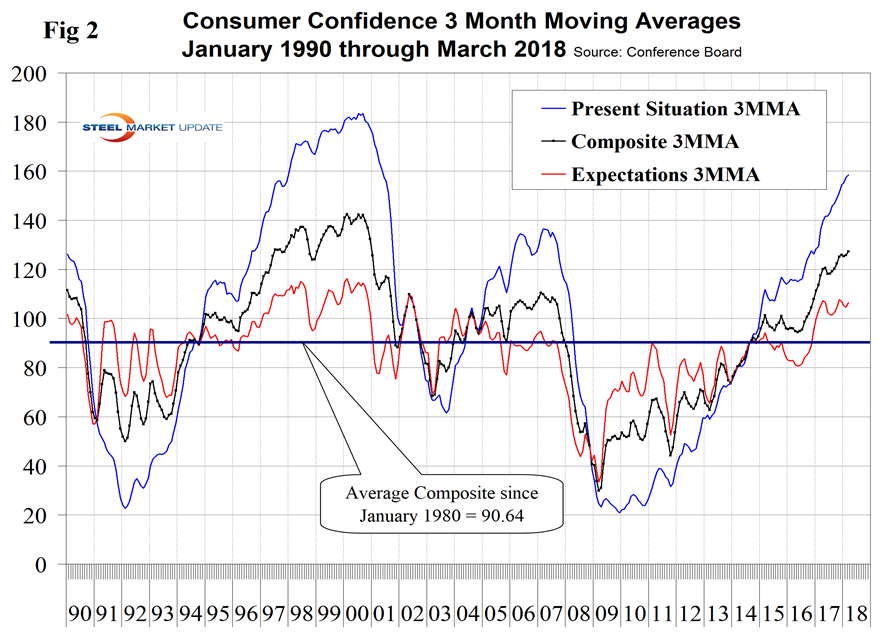
All three measures are now higher than they were at the pre-recession peak of 2007. The 3MMA of both components of the composite surged from mid-2016 until June 2017 when expectations briefly declined. Expectations have been relatively constant for a year, but the consumer’s view of the present situation is continuing to surge. Comparing March 2018 with March 2017, the 3MMA of the present situation jumped by 22.5 and expectations were up by 1.3 (Table 1).
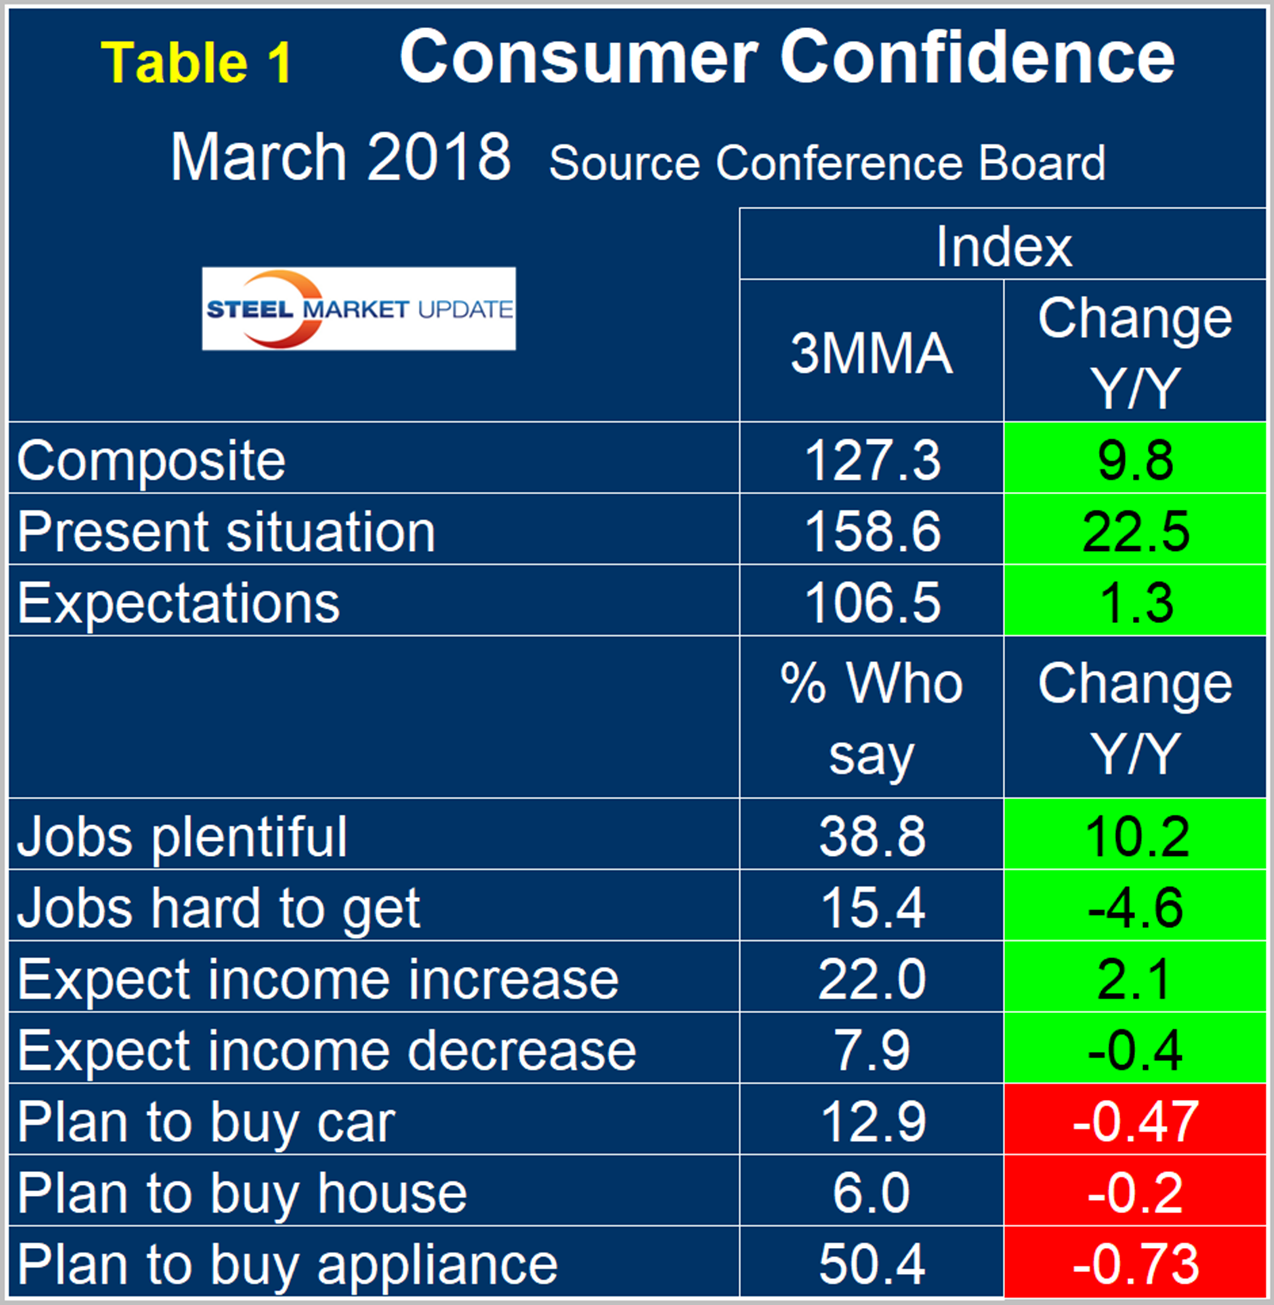
All sub-indices in Table 1 were green in December and January but plans to buy a car declined year over year in February. In this latest update, plans to buy a car, a house and an appliance all declined. The consumer confidence report includes encouraging data on job availability and wage expectations. It reports on the proportion of people who find that jobs are hard to get and those who believe jobs are plentiful, and it measures those who expect a wage increase or a decrease. Since February 2011, both of the employment components have steadily improved. The difference between those finding jobs plentiful and hard to get has been over 20 percent in the last five months and in March 2018 stood at 25.0 percent. Expectations for wage increases have been less consistent, but the differential between those expecting an increase and those expecting a decrease has been in positive double digits since January 2017. In March, plans to buy a house became negative year over year for the first time since March 2017. Plans to buy an appliance in March became negative for only the second time since August 2016.
Economy.com summarized as follows: “Consumer confidence slid 2.3 points in March, falling to 127.7 and reversing some of last month’s gain. Both the present situation index and the expectations index lost ground. Businesses are somewhat more pessimistic about their current conditions, though workers are still quite confident about the labor market. Expectations dropped across the board, with businesses and workers buying back some of last month’s gains. Purchasing plans took a hit, with autos falling to a six-month low and home purchasing plans falling to their lowest in more than a year. Inflation expectations softened slightly, but consumers expect higher interest rates and less stock price appreciation in the months to come.”
SMU Comment: Steel demand is dependent on the growth of GDP, which in turn is strongly influenced by consumer confidence and disposable income. The current consumer confidence report is excellent in both these respects.
About The Conference Board: The Conference Board is a global, independent business membership and research association working in the public interest. The monthly Consumer Confidence Survey®, based on a probability-design random sample, is conducted for The Conference Board by Nielsen, a leading global provider of information and analytics around what consumers buy and watch. The index is based on 1985 = 100. The composite value of consumer confidence combines the view of the present situation and of expectations for the next six months.


