

Market Data

April 2, 2018
SMU Analysis: Key Market Indicators Dip in March
Written by Peter Wright
Key market indicators tracked by Steel Market Update in March remain very positive, but took a small step back from the all-time highs reported in February.
Data released in March shows that 18 of the 36 indicators are historically positive with only 5 negative. The balance is within the band of historically normal. Trends deteriorated a bit, falling from 32 positive in February to 28 in March. Trends lead the present situation by about four months.
See the end of this piece for an explanation of the Key Indicators concept. This will explain the difference between our view of the present situation, which is subjective, and our analysis of trends, which is based on the latest facts available.
Please refer to Table 1 for our view of the present situation and the quantitative measure of trends. Readers should regard the color codes in the present situation column as a visual summary of the current market condition. The “Trend” columns of Table 1 are also color coded to give a quick visual appreciation of the direction the market is headed. All data included in this table was released in March. The month or specific date to which the data refers is shown in the second column from the far right. All results are the latest available as of March 31, 2018.
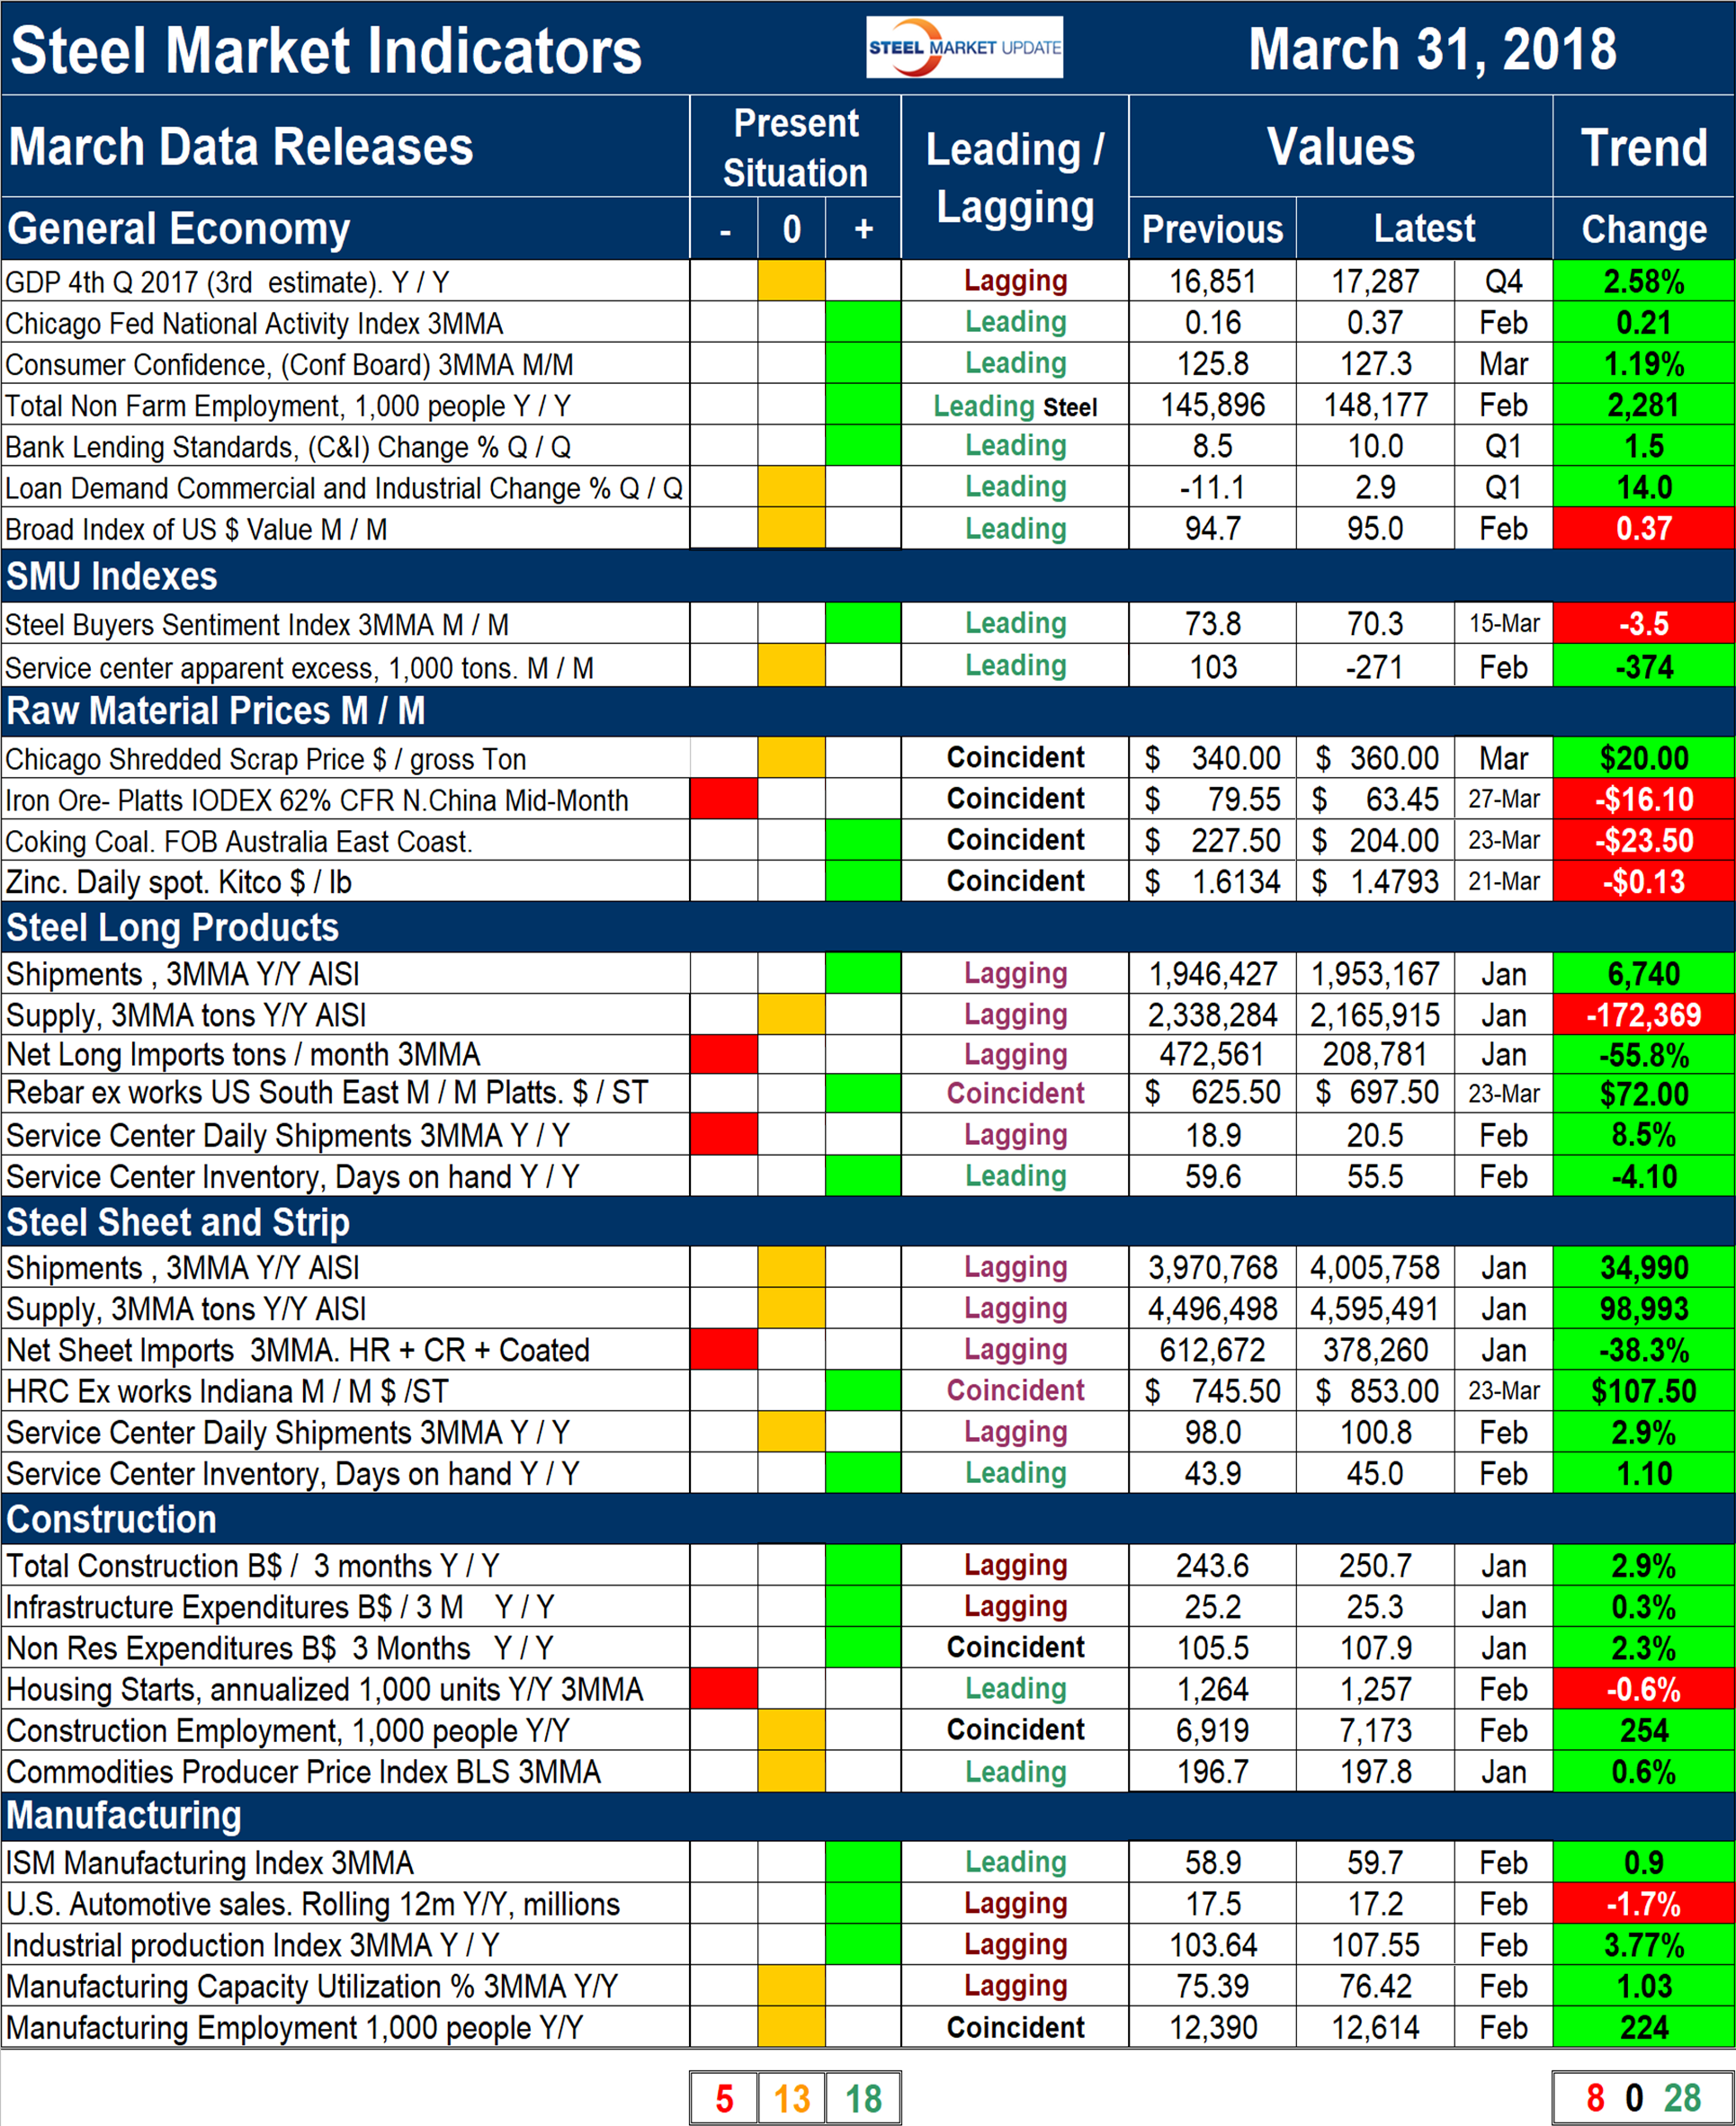
Present Situation
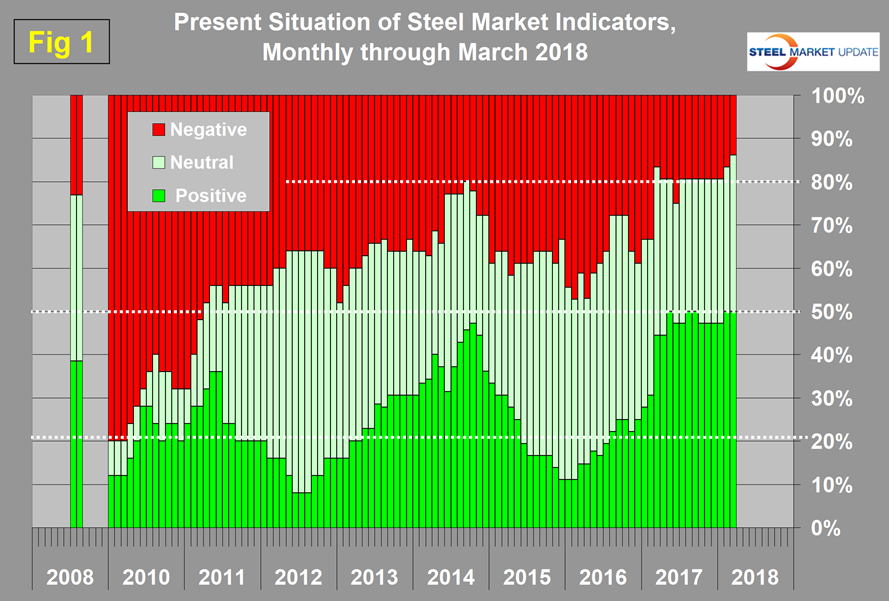
There was a net decrease of one negative and an increase of one neutral in our perception of the balance of indicators in March. We currently view 18 of the 36 indicators as positive, 13 as neutral and 5 as negative. Our intent in using the word neutral is to say that this indicator is in the mid-range of historical data. Figure 1 shows our monthly assessment of the present situation since January 2010 on a percentage basis. The number of negative perceptions is the lowest it has ever been in the history of this analysis. The only change that occurred in March was that our perception of the number of people employed in construction changed from negative to neutral. Our threshold is seven million, and in the February employment data from the BLS, construction employment increased to 7,173,000 jobs.
Trends
Most values in the trends columns are three-month moving averages (3MMA) to smooth out what can be very erratic monthly data. Trend changes in the individual sectors since the end of February data are described below together with some general comments. (Please note in most cases this is not March data but data that was released in March for previous months.)
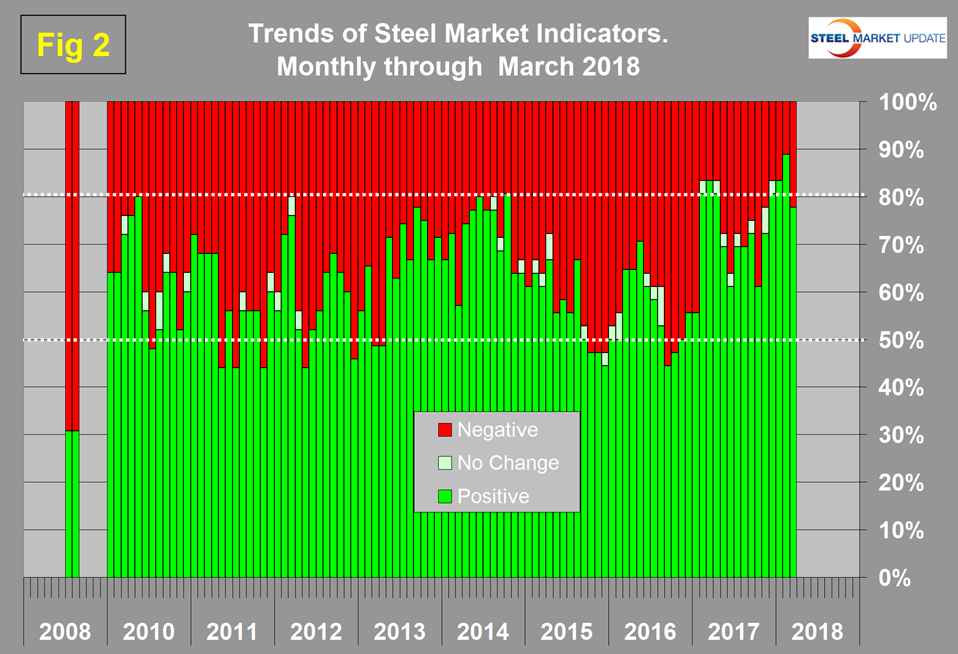
Figure 2 shows the trend of the trends and the pre-recession situation at the far left of the chart. The proportion of trends that are improving is now 77.8 percent of the 36 indicators. This was a decline from an all-time high of 88.9 percent in February.
Our observations about trends in the March data are as follows: The third estimate of GDP growth in fourth-quarter 2017 was released on Tuesday and improved from the second estimate. In the General Economy section of Table 1, there were two trend reversals. The Chicago Fed National Activity Index reversed direction and improved to 0.21 positive. The broad index value of the U.S. dollar strengthened, which we regard as a negative development because of its effect on net imports of steel and on the national trade balance.
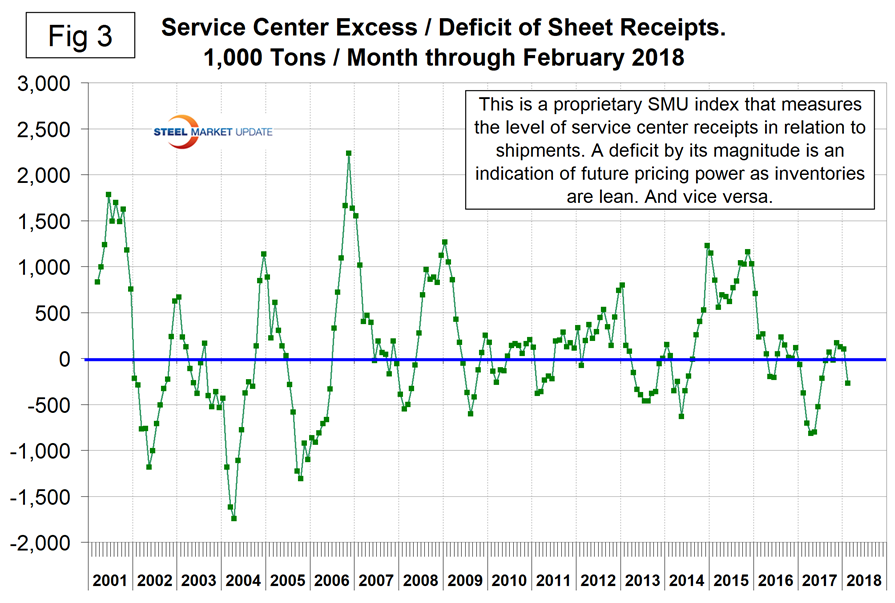
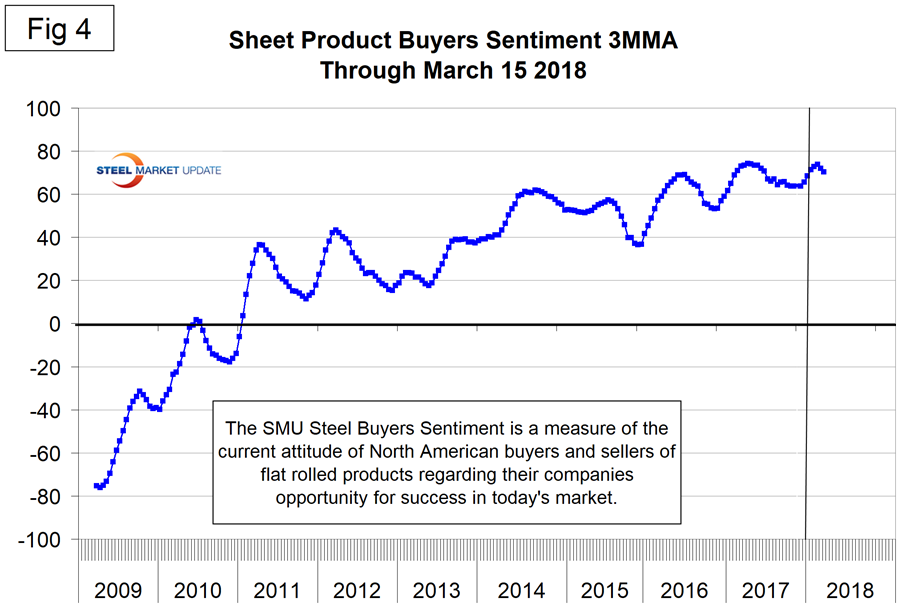
There was one trend reversal in the SMU proprietary indexes section. Service center excess of sheet products continued to improve in the February data. We regard an inventory deficit to be positive in terms of pricing power. In February, the surplus declined from 103,000 tons to negative 271,000 tons (Figure 3). The steel buyers’ sentiment changed direction and weakened from 73.8 in February to 70.3 in March (Figure 4).
There were three trend reversals in the raw materials section. This was the most concerning aspect of the March data. Iron ore, coking coal and zinc prices all declined. We regard falling raw materials prices as negative and indicative of a weakening global market.
There were no trend reversals in either the long products or sheet product sections.
In the construction sector, expenditures on infrastructure reversed direction and increased as housing starts reversed from growth to contraction. There were no trend changes in our manufacturing indicators.
We believe a continued examination of both the present situation and direction is a valuable tool for corporate business planning.
Explanation: The point of this analysis is to give both a quick visual appreciation of the market situation and a detailed description for those who want to dig deeper. It describes where we are now and the direction the market is headed, and is designed to describe the situation on a specific date. The chart is stacked vertically to separate the primary indicators of the general economy, of proprietary Steel Market Update indices, of raw material prices, of both sheet and long product market indicators, and of construction and manufacturing indicators. The indicators are classified as leading, coincident or lagging as shown in the third column.
Columns in the chart are designed to differentiate between where the market is today and the direction it is pointing. Our evaluation of the present situation is subjectively based on our opinion of the historical value of each indicator. There is nothing subjective about the trends section, which provides the latest facts available on the date of publication. It is quite possible for the present situation to be predominantly red and trends to be predominantly green or vice versa depending on the overall situation and direction of the market. The present situation is subdivided into, below the historical norm (-), (OK), and above the historical norm (+). The “Values” section of the chart is a quantitative definition of the market’s direction. In most cases, values are three-month moving averages to eliminate noise. In cases where seasonality is an issue, the evaluation of market direction is made on a year-over-year comparison to eliminate this effect. Where seasonality is not an issue, concurrent periods are compared. The date of the latest data is identified in the third values column. Values will always be current as of the date of publication. Finally, the far-right column quantifies the trend as a percentage or numerical change with color code classification to indicate positive or negative direction.


