

Market Data

April 30, 2018
BEA: U.S. GDP Slows Slightly in First Quarter
Written by Peter Wright
GDP growth slowed in the first quarter, but on a trailing 12-month basis has improved for the last seven quarters, according to Steel Market Update’s latest analysis of government data. The first estimate of GDP in the first quarter was 2.32 percent, down from 2.87 percent in Q4 2017.
Economy.com reported: “U.S. GDP growth moderated in the first quarter, but at least part of the slowdown is statistical, coming from residual seasonality in the data. Real GDP grew 2.3 percent, better than expected but below the 2.9 percent in the fourth quarter and the weakest growth in a year, according to the advanced estimate from the Bureau of Economic Analysis (BEA). Growth, though modest, was widespread including investment, consumer spending, trade and government. Imports and durable goods spending were drags. Real disposable income growth accelerated to 3.4 percent on the back of tax cuts, after rising 1.1 percent in the fourth quarter. The saving rate jumped to 3.1 percent, from 2.6 percent in the fourth quarter.”
GDP is measured and reported in chained 2009 dollars, and on an annualized basis in the first quarter was $17.386 trillion. The growth calculation is misleading because it takes the quarter-over-quarter change and multiplies by 4 to get an annualized rate. This makes the high quarters higher and the low quarters lower. Figure 1 clearly shows this effect. The blue line is the trailing 12-months’ growth and the black line is the headline quarterly result. On a trailing 12-month basis, GDP was up by 2.86 percent in Q1, which was the best result since Q2 2015 and better than the 2.18 percent average in 33 quarters since Q1 2010. Therefore, we conclude that the current growth of U.S. GDP is better than its average for the last nine years. The blue line in Figure 1 shows the slow but steady progress since Q2 2016.
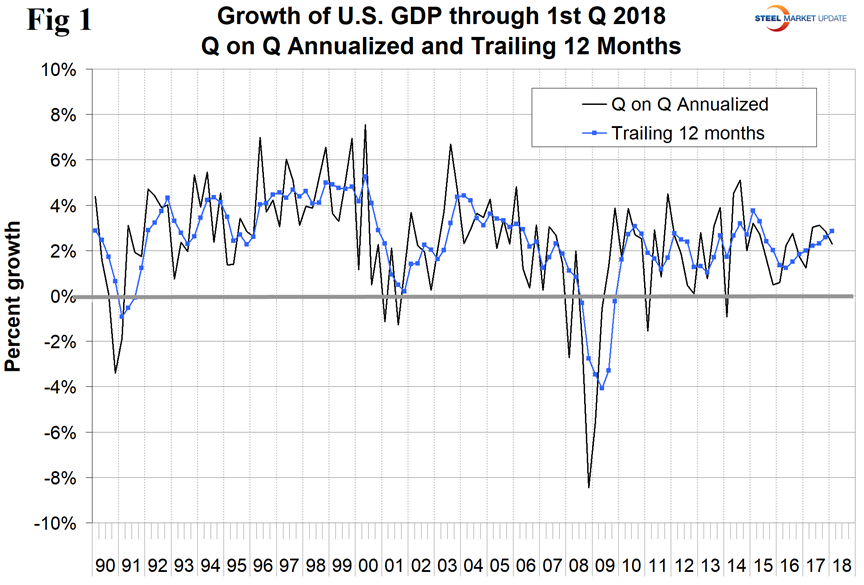
Figure 2 shows the headline quarterly results since 1990 and the April 2018 Congressional Budget Office forecast through 2022. The CBO is forecasting a 3.5 percent growth rate in Q2 2018 and that 2018 as a whole gets a boost from the tax break before falling back in 2019. The IMF forecasts global and national economic growth each April and October. In this month’s update, the forecast of U.S. economic growth in 2018 was revised up for the years 2018 through 2020, then revised down for 2021 and 2022. The IMF growth forecast for 2018 was revised up from 2.3 percent to 2.9 percent, and the 2019 forecast was adjusted from 1.9 percent to 2.7 percent.
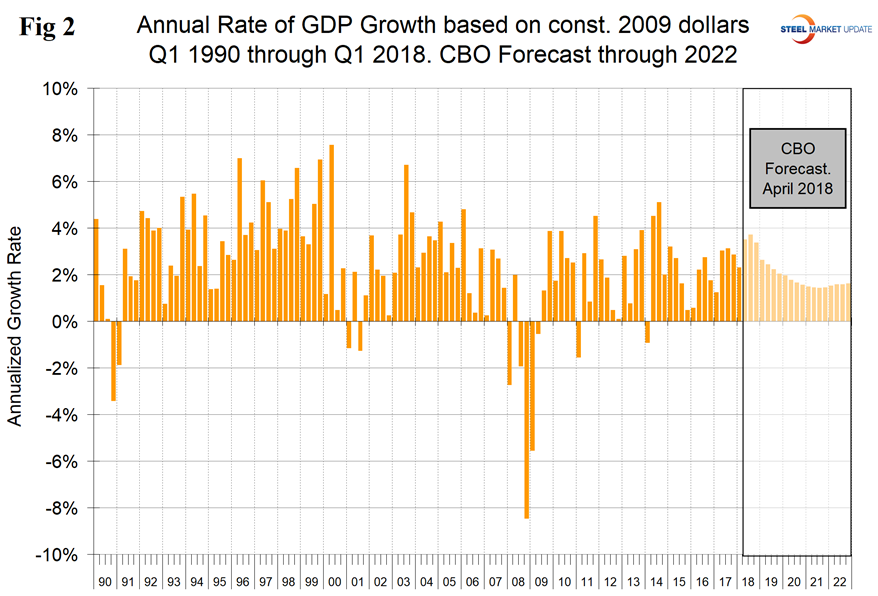
Figure 3 shows the change in the six major subcomponents of GDP in Q1 2018. Normally, personal consumption is the dominant growth driver but in the first quarter this component declined to 0.73 percent, which was the lowest since Q2 2013. Personal consumption includes goods and services, the goods portion of which includes both durable and non-durables. The contribution of inventories improved from negative 0.53 percent in Q4 2017 to positive 0.43 percent in Q1 2018. Rising inventories are entered as a positive in the GDP calculation. Note that in the definitions at the end of this piece, inventories are not mentioned. Over the long run, inventory changes are a wash and simply move growth from one period to another. In the first three quarters of 2017, net exports made a positive contribution, influenced by the decline in the value of the dollar that continued through early September 2017. In Q4 2017, net exports made a negative contribution that returned to positive 0.2 percent in Q1 2018. The contribution of government expenditures was almost zero in the period Q2 2016 through Q3 2017, but made a 0.5 percent contribution in Q4 and 0.2 percent in Q1 2018.
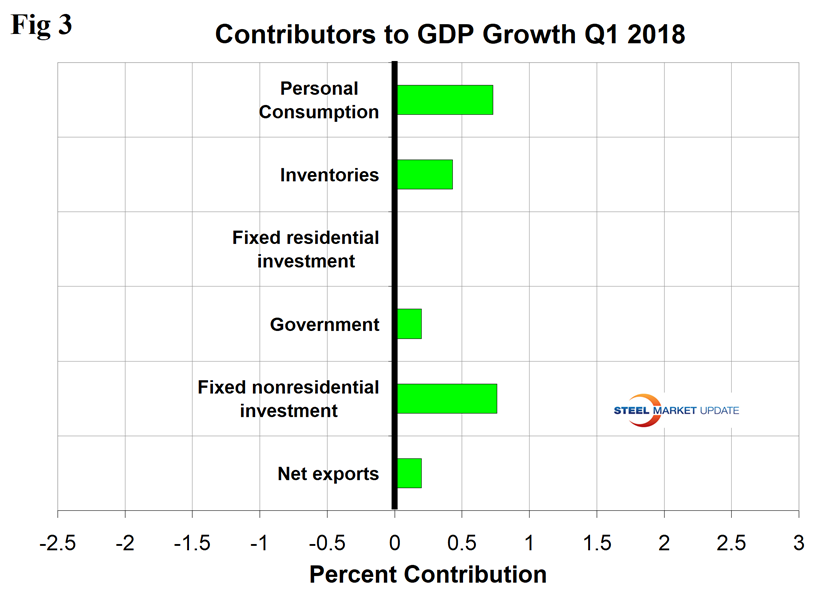
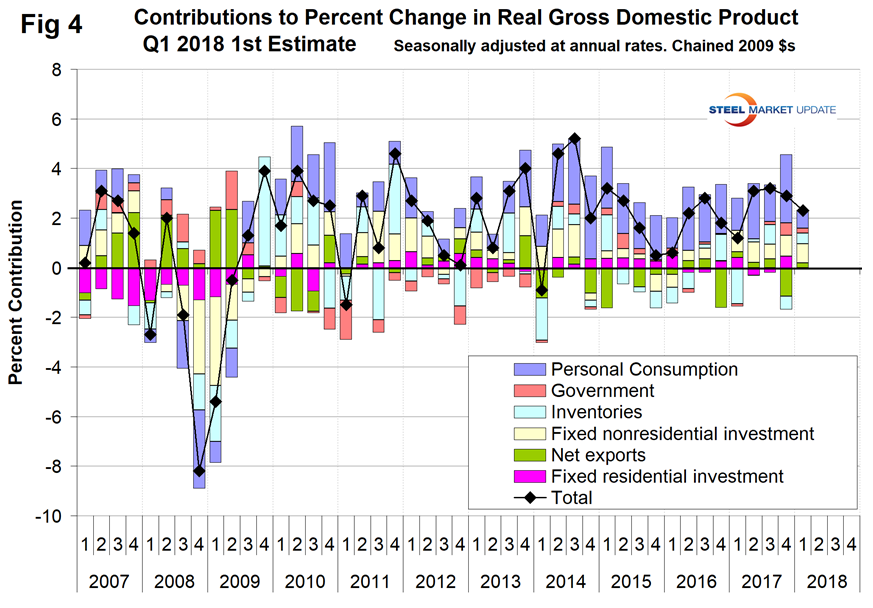
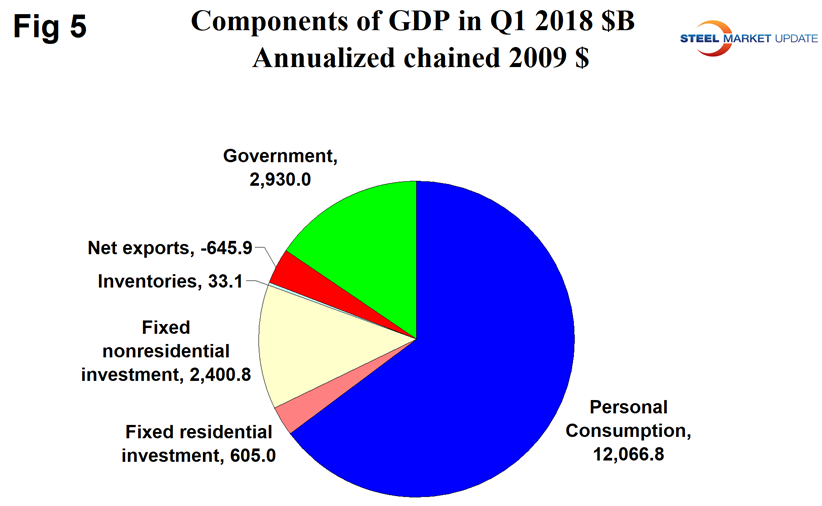
Figure 4 shows the quarterly contributors of the six major subcomponents of GDP since Q1 2007. None of the six major categories made a negative contribution in Q1, which was the first time for such a result since Q3 2014. This chart clearly shows the whipsaw effect of inventory changes. Figure 5 shows the breakdown of the $18 trillion economy.
SMU Comment: This was a rather subdued result with personal consumption being down significantly and no negatively contributing components. The trailing 12-month growth rate has improved for each of the last seven quarters and in Q1 reached 2.86 percent. This is high enough to stimulate future steel consumption, which requires a 2.2 percent growth to break even.
Definition of GDP: Gross domestic product (GDP) is the value of the goods and services produced by the nation’s economy less the value of the goods and services used up in production.
GDP is defined as Consumption (C) plus Investment (I) plus Government Spending (G) plus [Exports (E) minus Imports (I)] or: GDP = C + I + G + (E-I)
This equation is known as an identity. An identity is an equality that remains true regardless of the values of any variables that appear within it. That means it is not a guess or an approximation. It is simple reality.
National savings is GDP minus (consumption plus government spending). That means that investment equals savings plus net exports. If there are no net exports, then money must come back into the U.S. from outside the country to finance investments, along with savings.
Thus, if there is a government deficit, there must be savings by both consumers and businesses, plus capital flows from outside the country, to offset that deficit for there to be any money left over for investments.
Another definition of GDP states that it equals the growth in working population multiplied by their productivity.


