

Prices

May 10, 2018
Flat Roll Imports by District of Entry and Source-March 2018
Written by Peter Wright
This analysis breaks down the imported tonnage of six flat rolled products by district of entry and source country. Our intent is to describe in detail what is going on in a company’s immediate neighborhood and thus provide a negotiating advantage for Steel Market Update subscribers.
Premium ![]() members will find reports here on our website that break down the import tonnage through March into the port of entry and country of origin in metric tons. Products analyzed in this way are HRC, CRC, HDG sheet, OMC sheet, CTL plate and coiled plate. This data set is large; therefore, we will make no attempt to provide a commentary. Each reader’s interest will be different and he or she simply needs to select one of the six products, then find the nearest port or ports of entry to see how much came into the region each month and from where. Monthly data is provided back to January 2015. It is clear from these detailed reports that the change in tonnage entering a particular district in many cases is completely different to the change in volume at the national level.
members will find reports here on our website that break down the import tonnage through March into the port of entry and country of origin in metric tons. Products analyzed in this way are HRC, CRC, HDG sheet, OMC sheet, CTL plate and coiled plate. This data set is large; therefore, we will make no attempt to provide a commentary. Each reader’s interest will be different and he or she simply needs to select one of the six products, then find the nearest port or ports of entry to see how much came into the region each month and from where. Monthly data is provided back to January 2015. It is clear from these detailed reports that the change in tonnage entering a particular district in many cases is completely different to the change in volume at the national level.
Here are some examples to illustrate why this information can be actionable: Hot rolled coil imports year-to-date through March were up by 35 percent. But Chicago was down by 80 percent and Houston was up by 150 percent. Cold rolled coil imports declined by 22 percent in the first three months of the year. But Boston was up by 27 percent and Columbia Snake was down by 48 percent. The variance between the national total and the individual regions is why we think it’s important for both market understanding and negotiating position to know what’s going on in your own backyard.
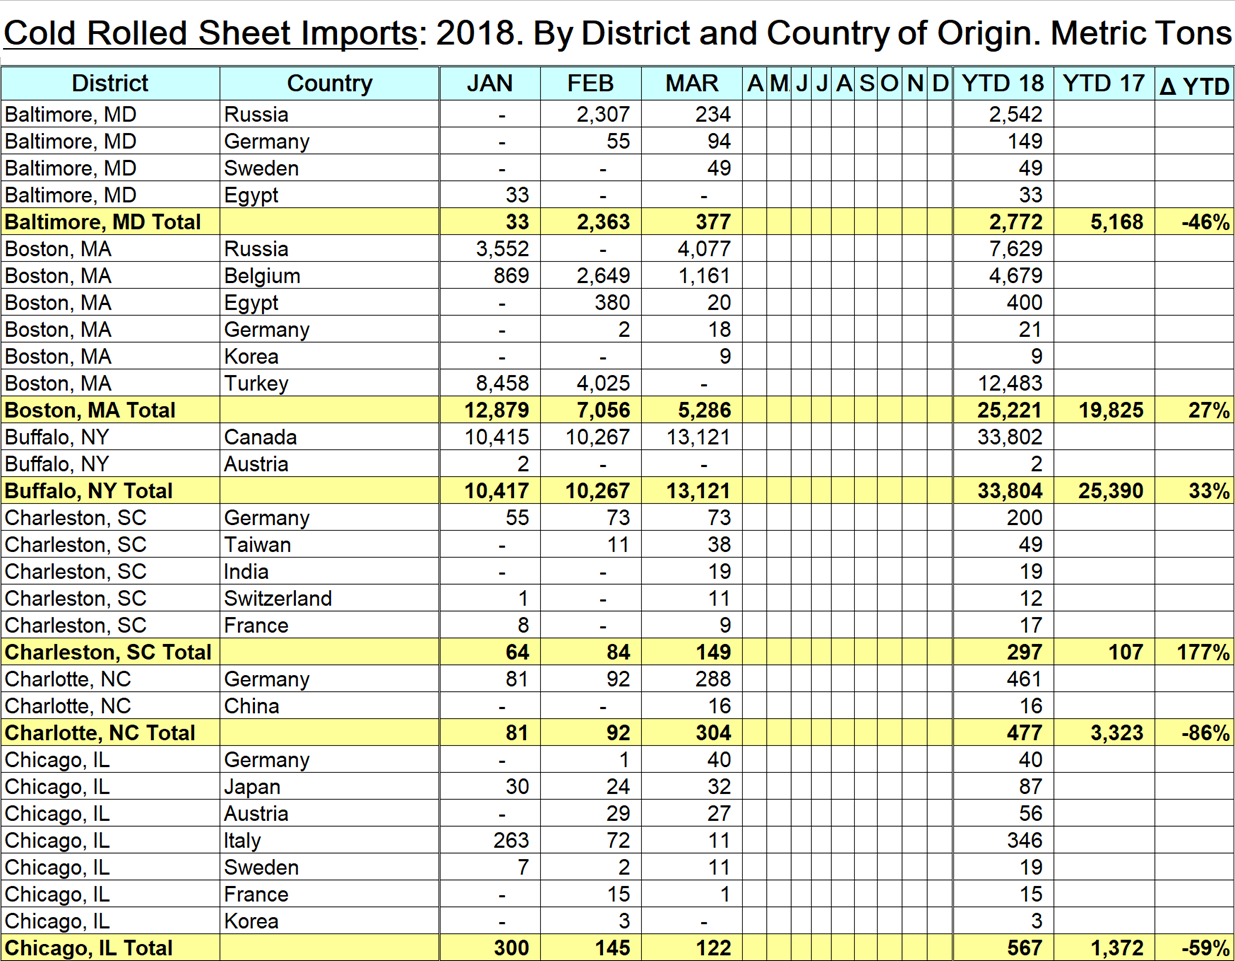
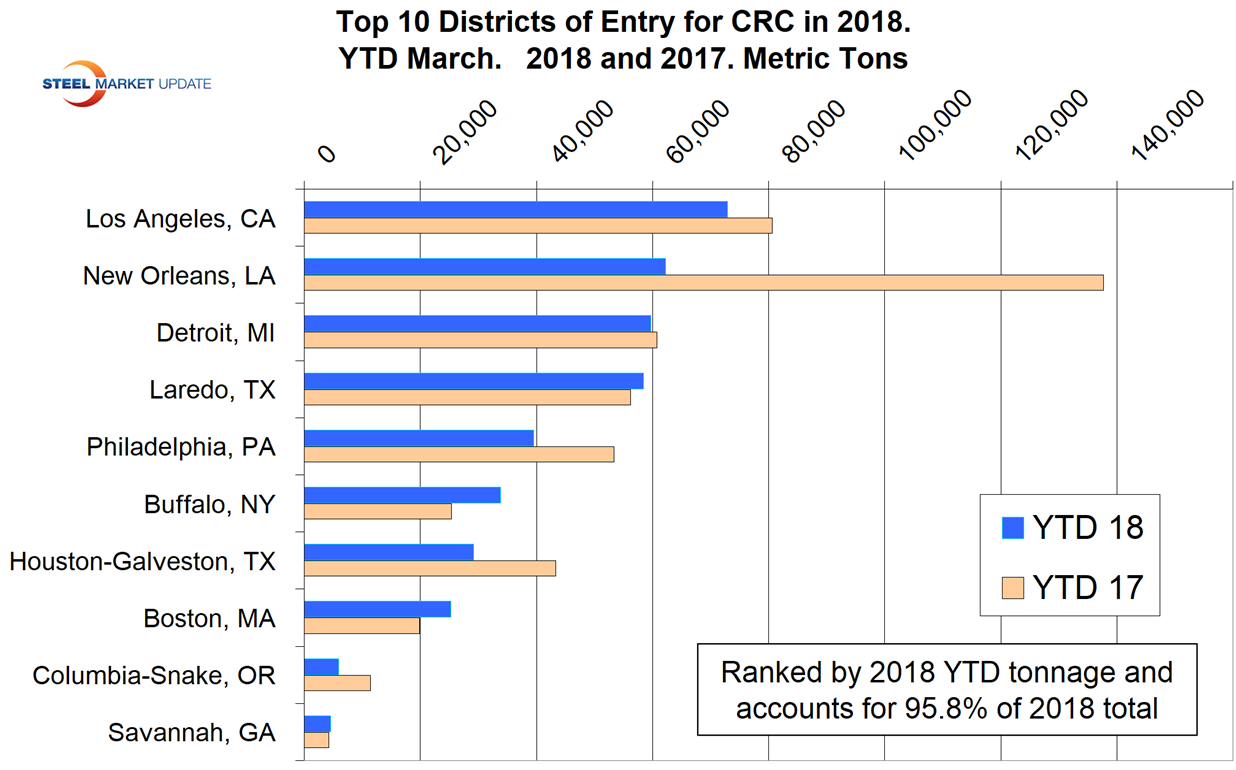
The table included here is a small part of the detailed analysis of the cold rolled tonnage. The bar graph shows the tonnage of CR that entered the top 10 districts in YTD March for 2017 and 2018 ranked by 2018 tonnage. Los Angeles had the most tonnage through March, and the top 10 districts accounted for 95.8 percent of the total national tonnage.
The data in these detailed reports is compiled from tariff and trade data published by the U.S. Department of Commerce and the U.S. International Trade Commission. Our other import reports are sourced from U.S. Department of Commerce, Enforcement and Compliance, aka the Steel Import Monitoring System. In the development of these reports by district and source country, we have discovered that the SIMA data for HRC and CRC contains some high-alloy steel such as stainless and tool steel, which have been misclassified at the ports. These alloy steels are not included in our detailed reports, which results in a small discrepancy between the two data sets.


