

Market Data

May 30, 2018
Consumer Confidence Hits High Mark in May
Written by Peter Wright
In May, consumer confidence improved to the highest level since December 2000, according to the latest findings from The Conference Board’s Consumer Confidence Survey. The composite value of consumer confidence in May was 128.0, up from 125.6 in April.
While consumer confidence increased in May from April’s downwardly revised result, the three-month moving average (3MMA) showed a decline for the first time this year. The 3MMA decreased from 127.5 in April to 126.9 in May. Consumer confidence data has been quite volatile since early 2016, therefore the 3MMA, which smooths out the peaks and valleys, probably offers a more accurate reflection of the prevailing consumer sentiment, which is still very positive. May’s 3MMA was 6.2 points higher than in May 2017.
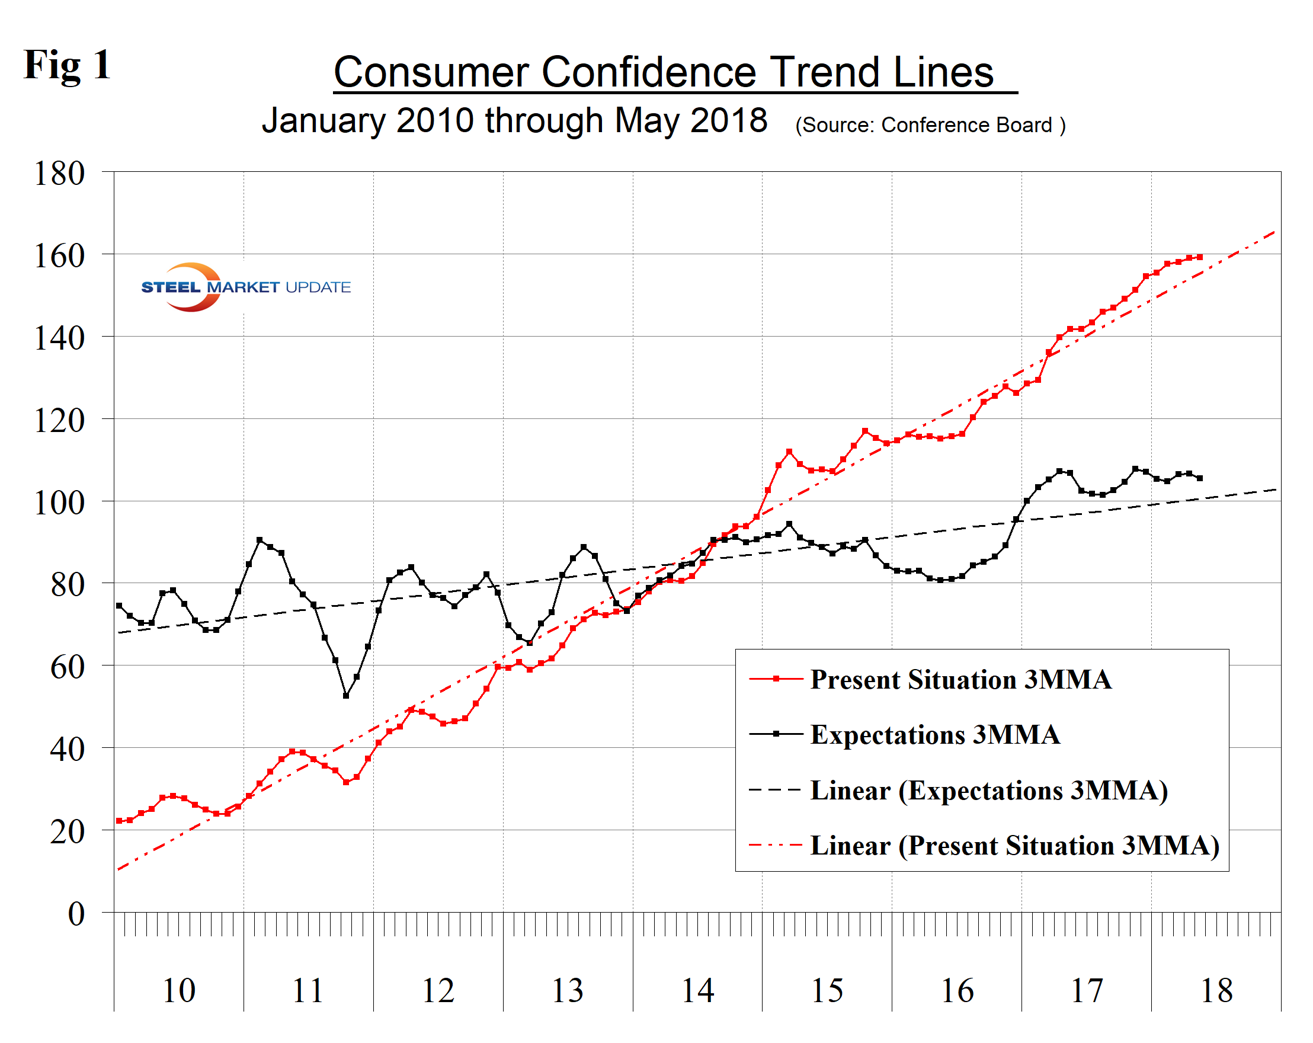
The composite index is made up of two sub-indexes representing the consumer’s view of the present situation and his or her expectations for the future. Both are above their nine-year trend line (Figure 1).
The historical pattern of the 3MMA of the composite, the view of the present situation and expectations since January 1990 are shown in Figure 2.
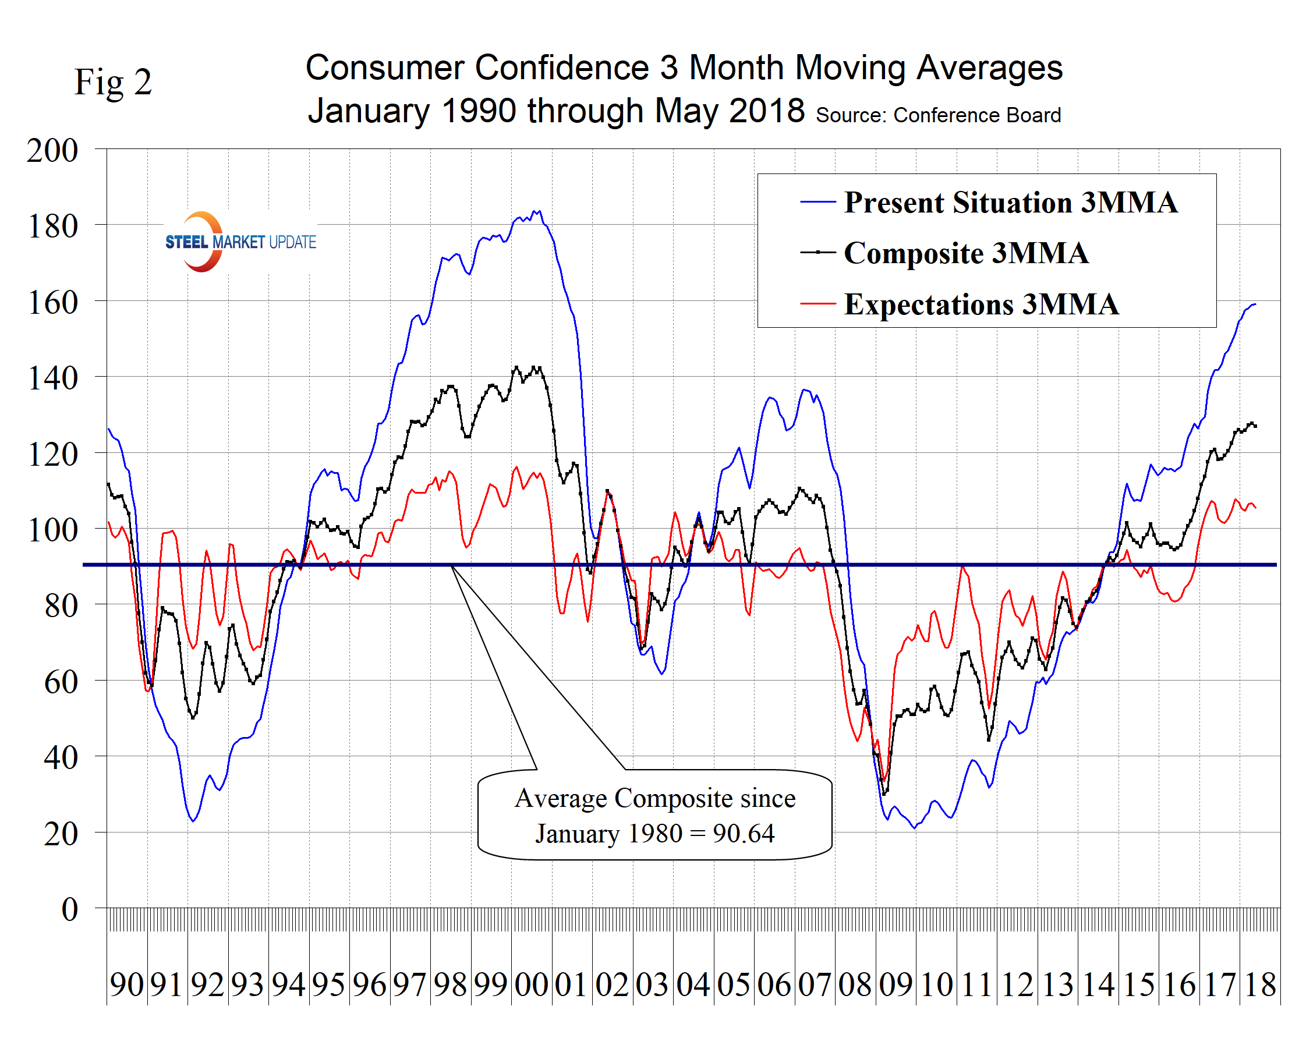
All three measures are now higher than they were at the pre-recession peak of 2007. The 3MMA of both components of the composite surged from mid-2016 until June 2017 when expectations briefly declined. Expectations have been relatively constant for a year, but the consumer’s view of the present situation is continuing to surge. Comparing May 2018 with May 2017, the 3MMA of the present situation was up by 17.4 and expectations were down by 1.3 (Table 1). This was the first time for expectations to be down since October 2016.
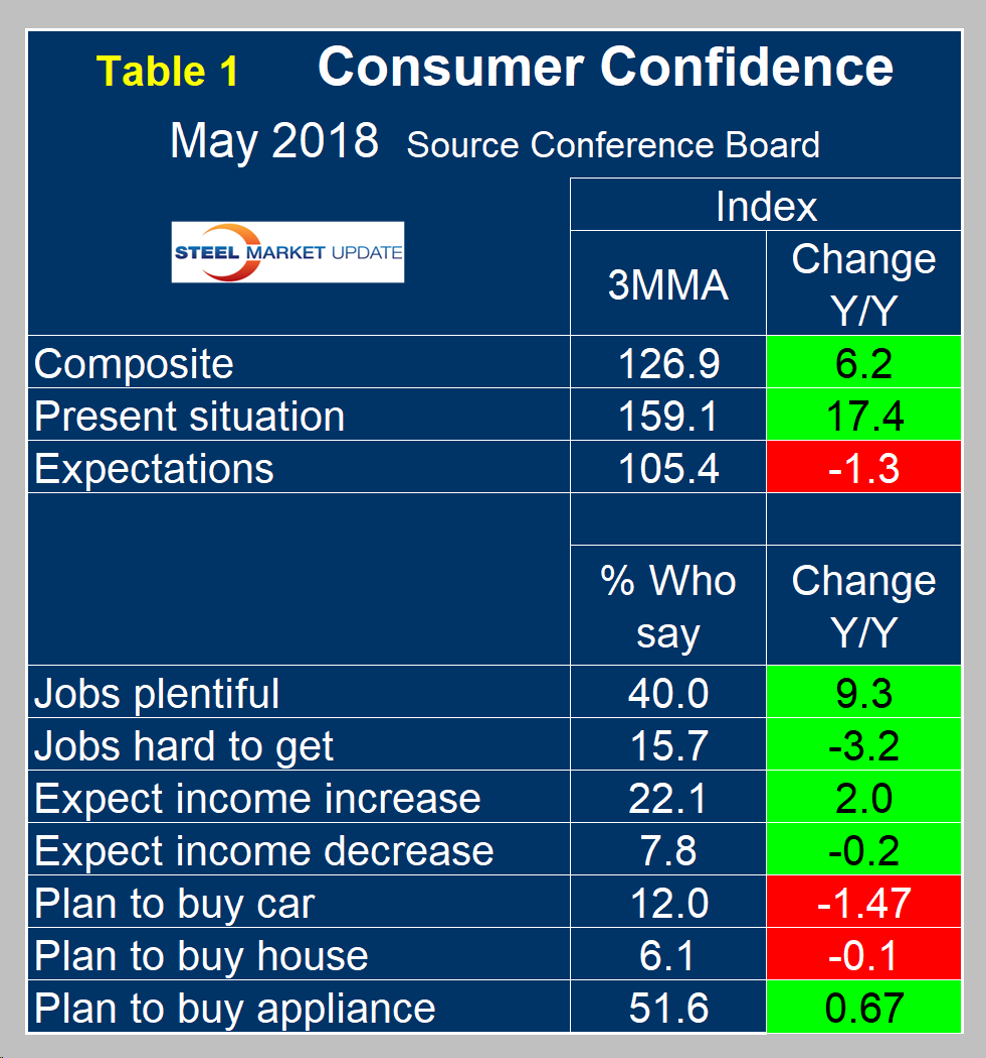
In May, the color designations in Table 1 deteriorated. In April, only plans to buy a car declined. In May, housing also had a slight decline. The consumer confidence report includes encouraging data on job availability and wage expectations. It reports on the proportion of people who find that jobs are hard to get and those who believe jobs are plentiful, and it measures those who expect a wage increase or a decrease. Since February 2011, both of the employment components have steadily improved. The difference between those finding jobs plentiful and hard to get has been over 20 percent in the last six months and in May 2018 stood at 26.6 percent. Expectations for wage increases have been less consistent, but the differential between those expecting an increase and those expecting a decrease has been in positive double digits since January 2017.
SMU Comment: Steel demand is dependent on the growth of GDP, which in turn is strongly influenced by consumer confidence and disposable income. The current consumer confidence report continues to be excellent in both these respects.
About The Conference Board: The Conference Board is a global, independent business membership and research association working in the public interest. The monthly Consumer Confidence Survey®, based on a probability-design random sample, is conducted for The Conference Board by Nielsen. The index is based on 1985 = 100. The composite value of consumer confidence combines the view of the present situation and of expectations for the next six months.


