Market Data

June 12, 2018
Import Market Share Through April
Written by Peter Wright
This Steel Market Update report examines the import share of sheet, plate, long and tubular products and 18 subcategories.
Table 1 (click to enlarge) shows total supply to the market in three months through April and in 12 months through April for the four product groups and the 18 sub-categories. Supply to the market is the total of domestic mill shipments to domestic locations plus imports. It shows imports on the same three- and 12-month basis and then calculates import market share for the two time periods for 18 products. Finally, it subtracts the 12-month share from the three-month share and color codes the result green or red. If the result of the subtraction is positive, it means that import share is increasing and the code is red. The big picture is that in most cases import share has negative momentum when comparing the 12-month with the three-month rates. Exceptions are HR sheet, standard pipe, line pipe, rebar, heavy structurals and light shapes.
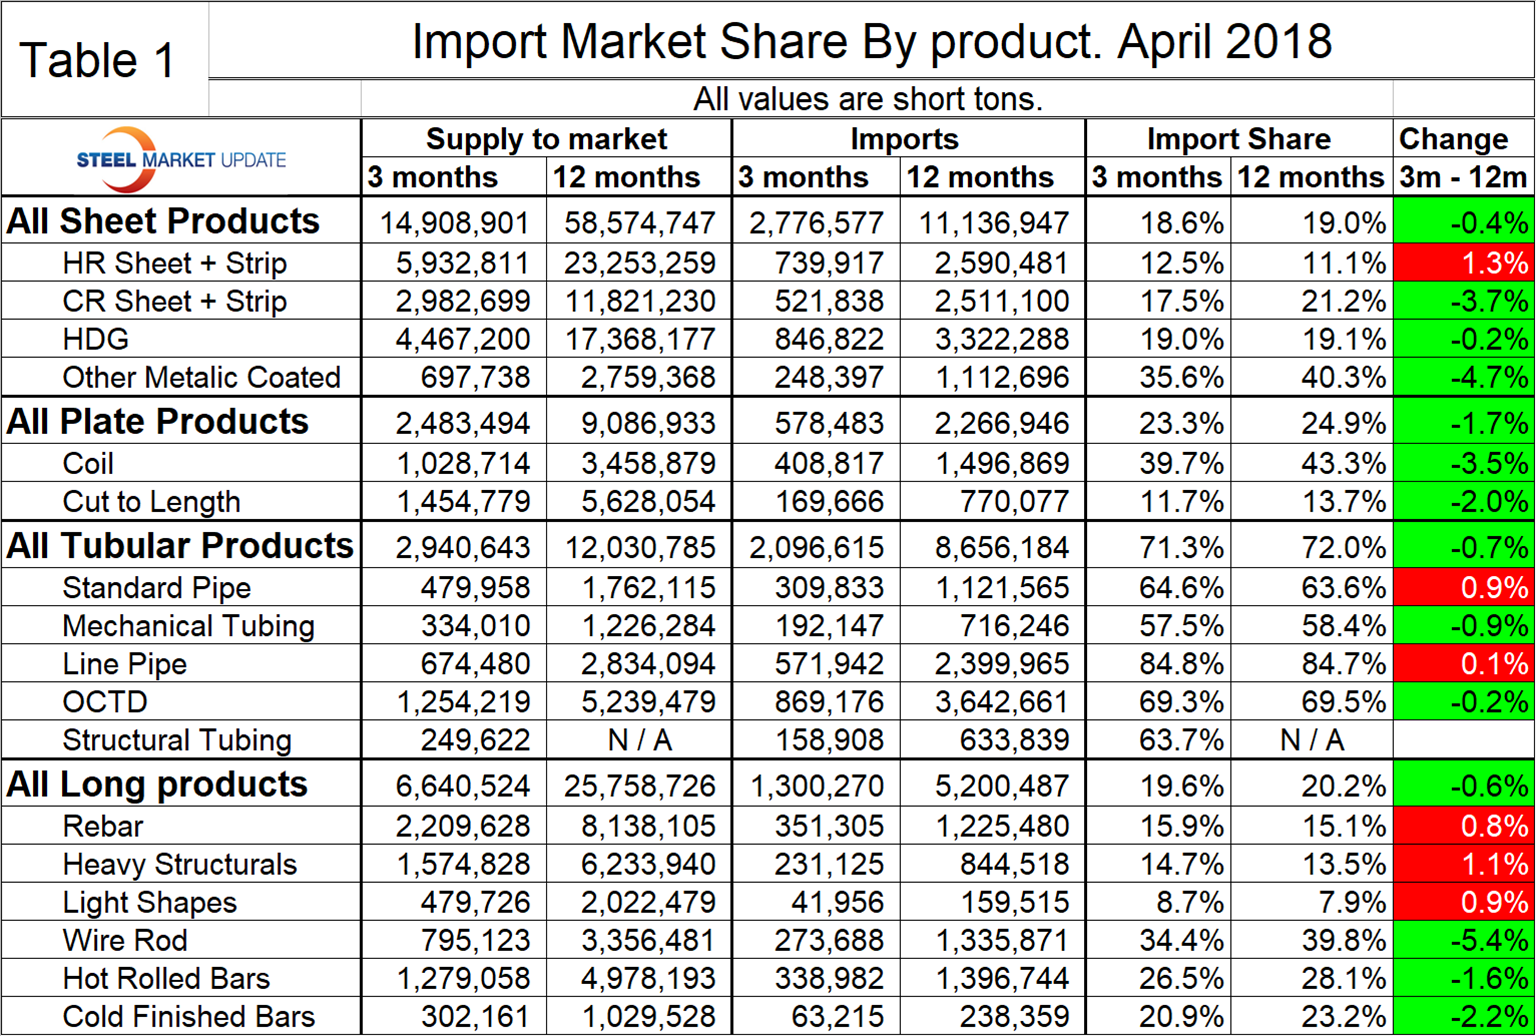
There is a huge difference in import market share between products, with tubular goods being by far the worst case. In the tubular section of Table 1, we’ve left the import share of structural tubing blank because source data for domestic production prior to April 2017 made no sense.
Figure 1 shows the historical import market share of plate and total sheet products. The import share of plate has been decreasing erratically for three years as sheet products have been relatively flat since early 2016.
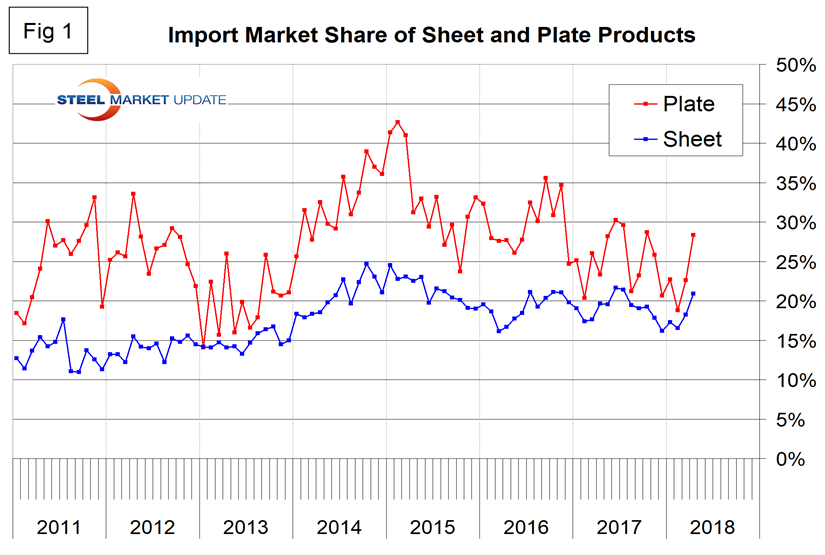
Figure 2 shows the import market share of the four major sheet products. Other metallic coated (mainly Galvalume) has by far the highest import market share and hot rolled has the lowest.
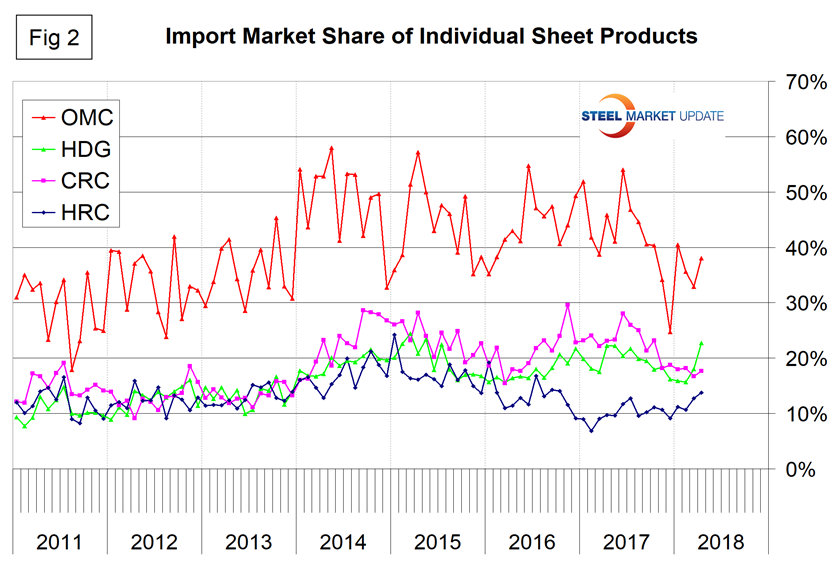
Figure 3 breaks out coiled and CTL plate from the total and shows that coil imports currently have almost five times the market share of CTL imports.
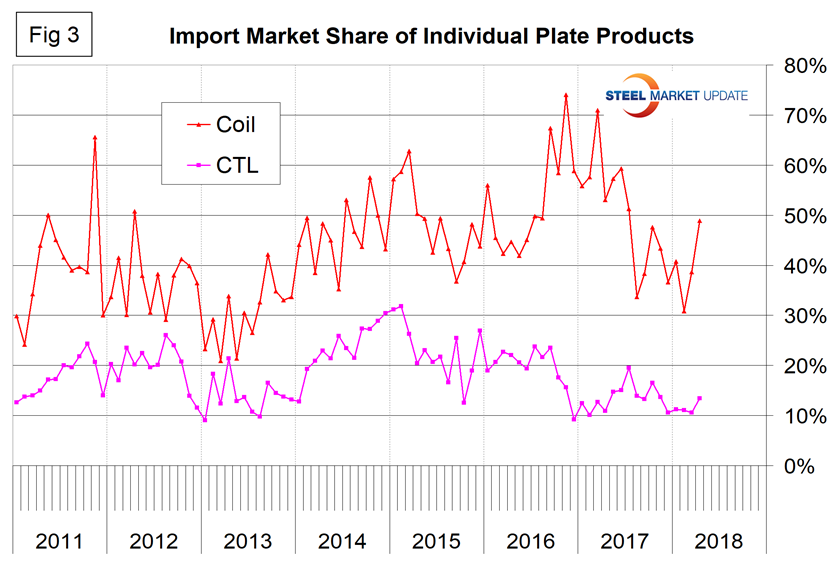
Figure 4 describes the total import share of tubular goods and long products. It is evident as we work the numbers that data for the domestic production of tubulars is much less reliable than for other products. Domestic shipments are definitely understated for some products, and we suspect for all. This is probably because of a more fragmented supply chain and the independent tubers not reporting to the extent that the steel mills do for other products. This has the result of increasing the apparent import market share.
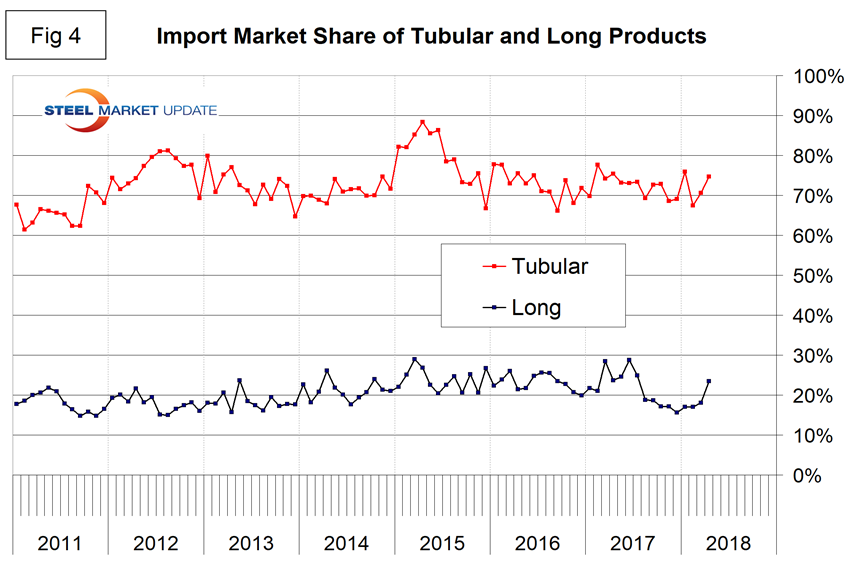
Figure 5 shows the import market share of the individual tubular products. Based on the available information, all are very high compared to other steel product groups, and line pipe is the highest.
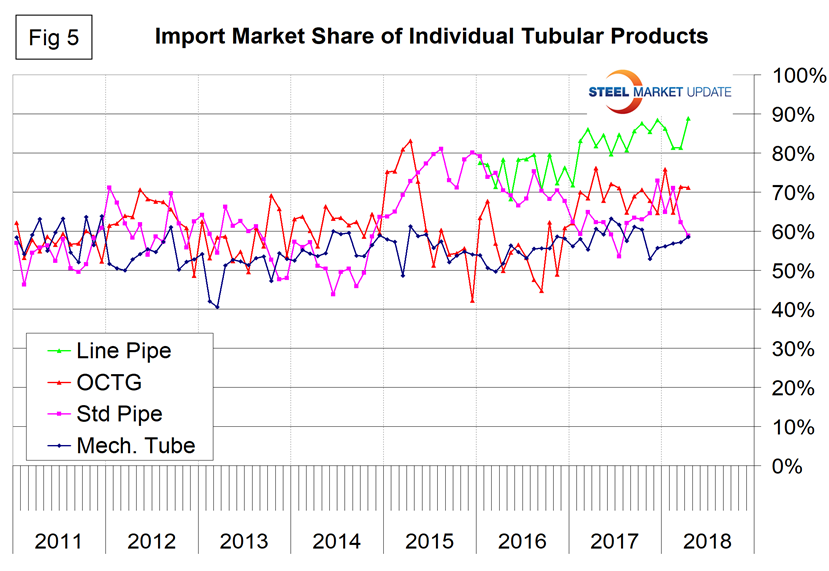
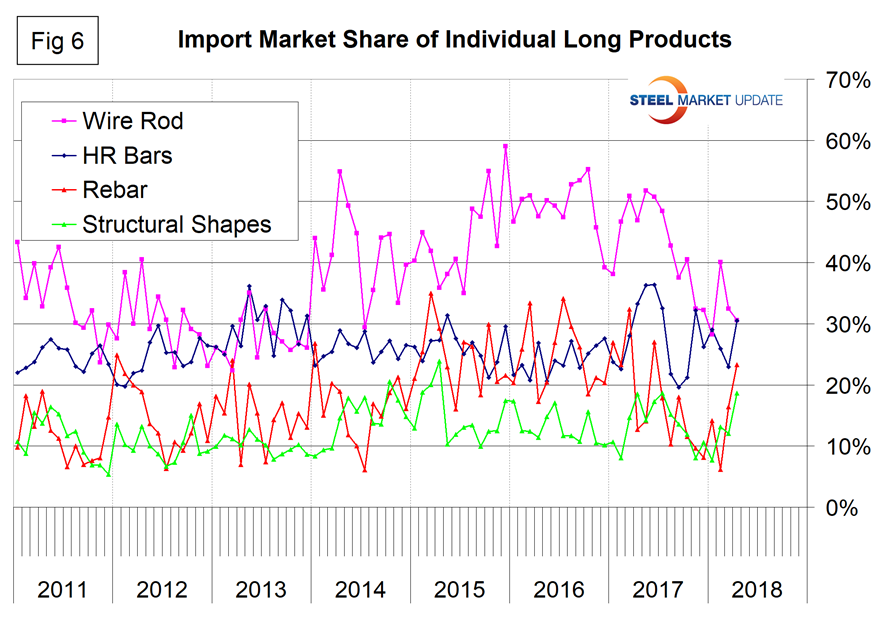
Figure 6 shows the detail for the four major sectors of the long products group. The import share of longs has been erratic this year. Wire rod has historically had by far the highest import share, and to make matters worse the imports of drawn wire are also very high. The highest volume item of Chinese steel imports to the U.S. is currently drawn wire.