

Market Data

June 14, 2018
SMU Premium-Level Report: HDG Imports by Region
Written by Tim Triplett
Editor’s Note: Not a Premium-level subscriber to SMU? See the sample Premium report below:
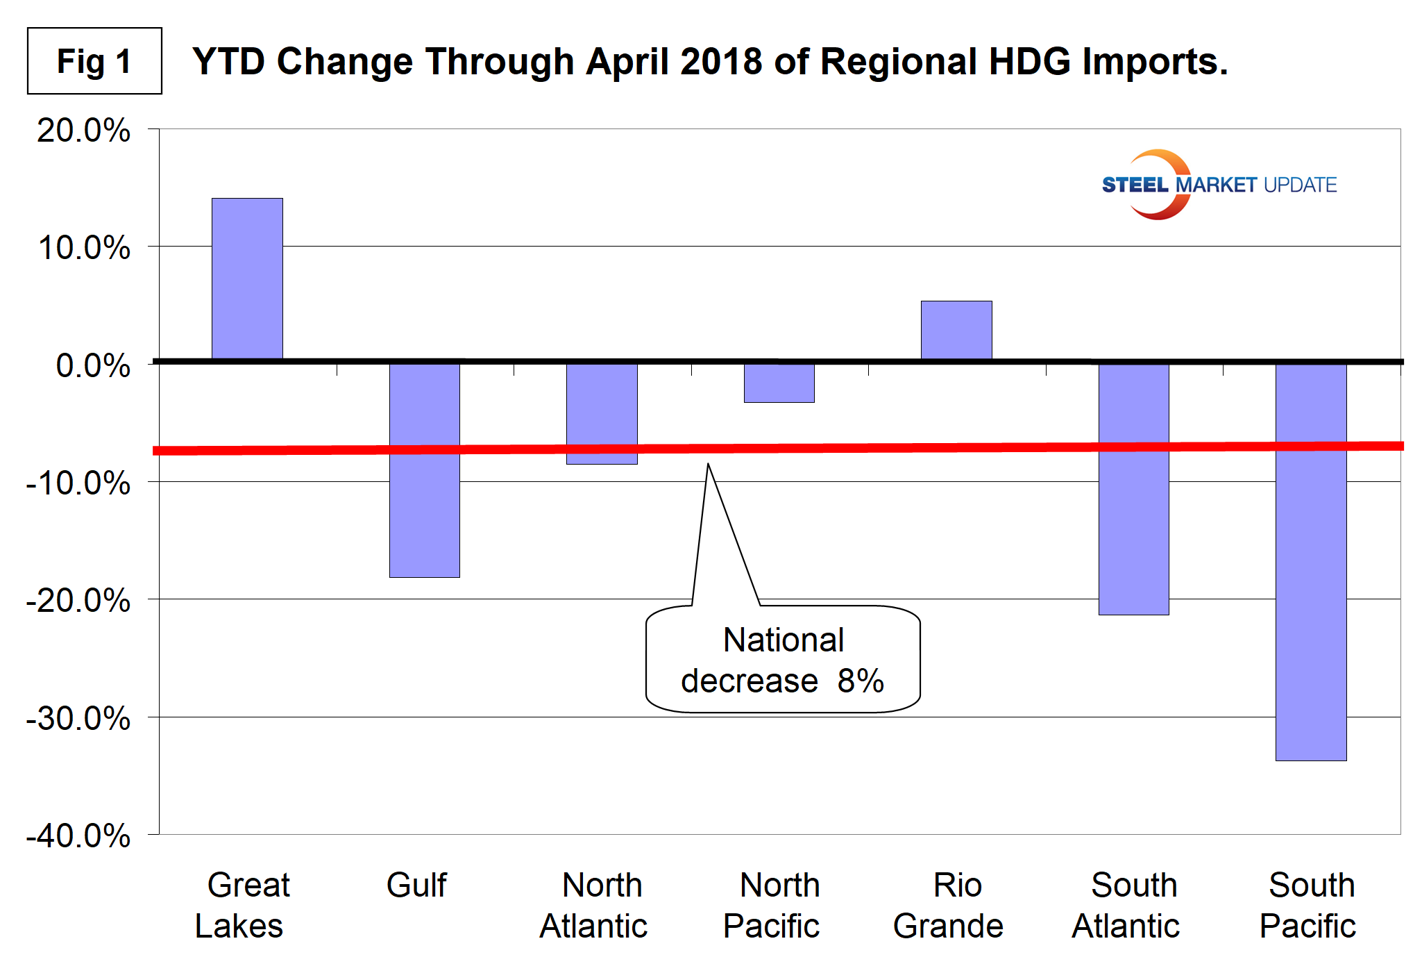
Imports of hot-dipped galvanized sheet into the U.S. as a whole declined by 8 percent year to date through April, but the Great Lakes region was up by 14.1 percent and the South Pacific was down by 33.8 percent.
Imports can vary significantly from one region to another. Steel Market Update has produced import reports by product at the national level and detailed reports at the port level by source nation. This new analysis of U.S. International Trade Commission data plugs the gap between SMU’s other reports by identifying changes at the regional level. Produced for the first time this week are reports on hot rolled, cold rolled and hot-dipped galvanized steel.
Data for this report on HDG covers March 2015 through April 2018. The next report we publish will have data back to March 2013.
Figure 1 shows the year-to-date change in HDG imports for each of seven regions and the change at the national level. The variability was considerable, with the South Pacific region down by 33.8 percent and the Great Lakes region up by 14.1 percent. The other regions ranged between these extremes with five showing year-over-year contraction and two with increasing volume.
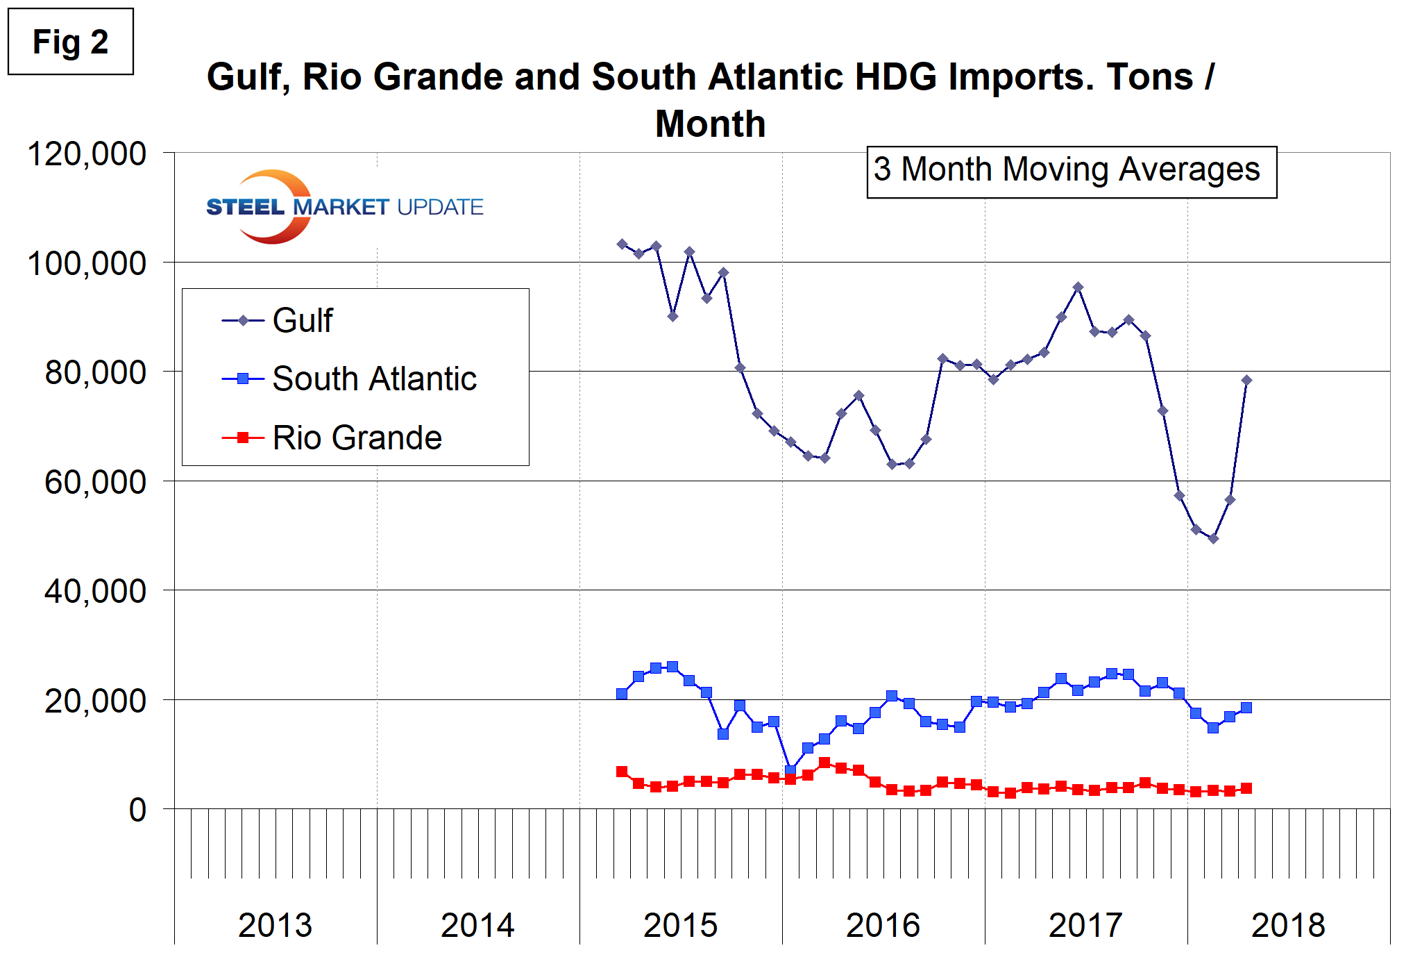
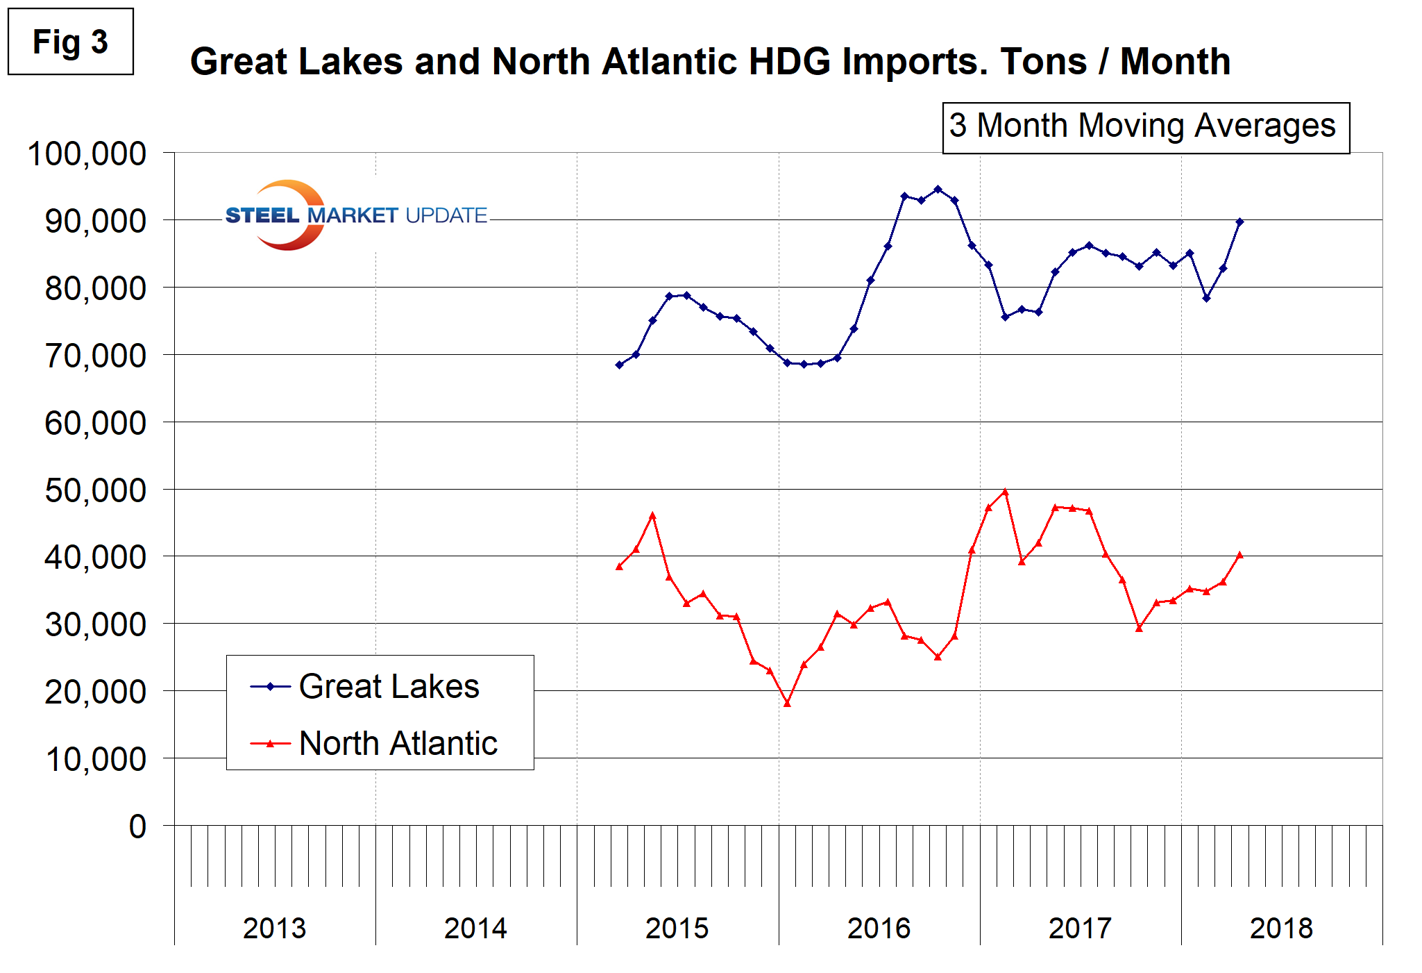
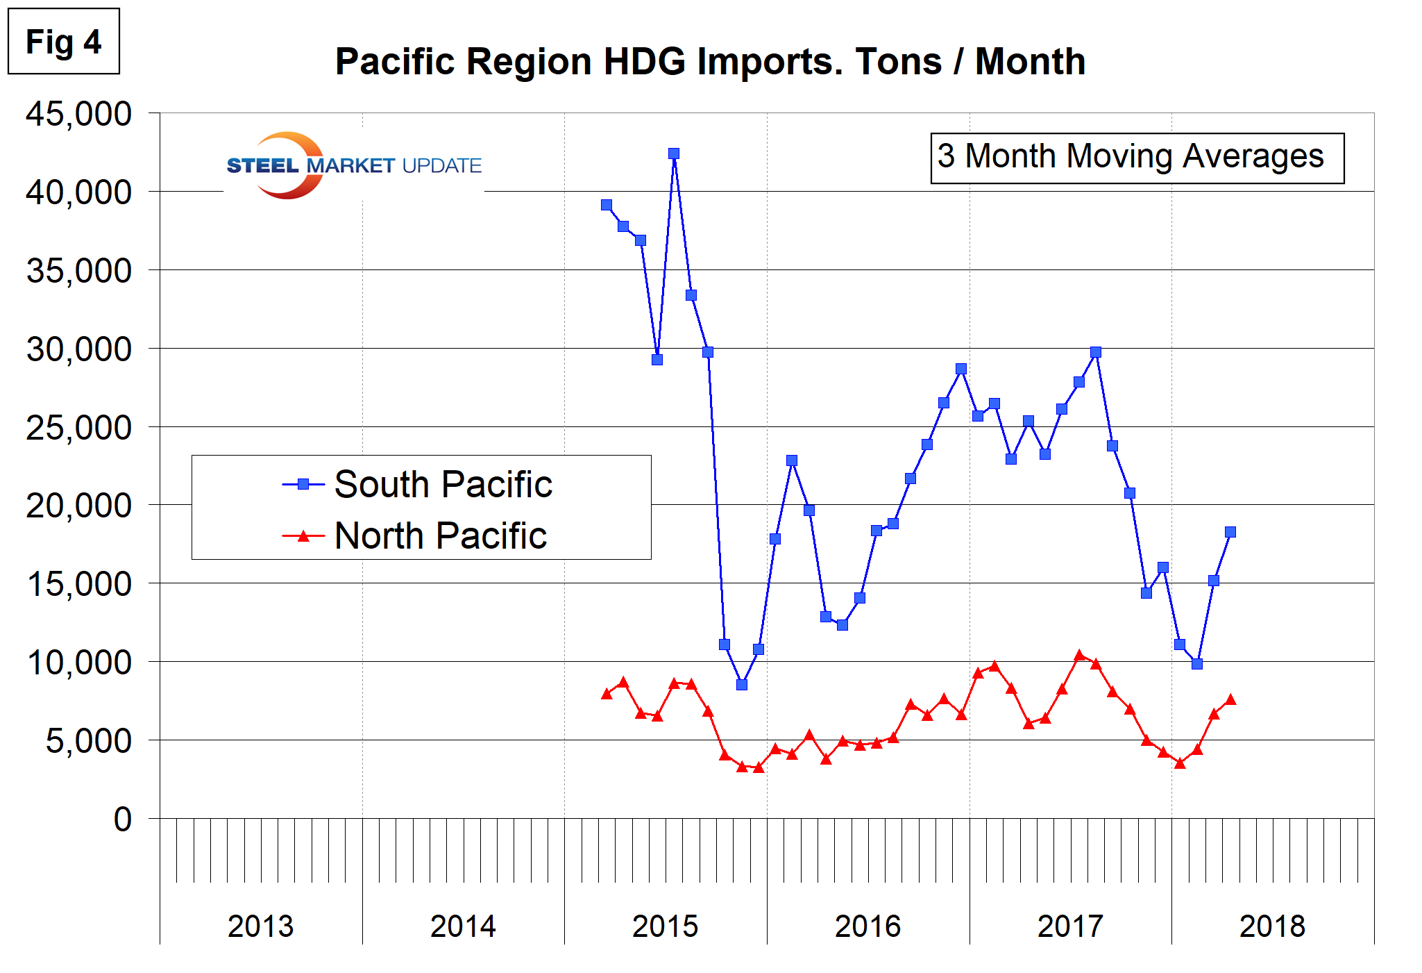
Figures 2, 3 and 4 show the history of HDG coil imports by region since March 2015 on a three-month moving average basis.
Imports into the Gulf have been erratic in the time frame shown. There was a huge spike in April 2018 that is masked somewhat by the three-month moving average. The greatest contribution to this spike was tonnage into Houston from Russia and Vietnam. Russia also returned to New Orleans after being almost absent for the first quarter of 2018. Imports into the South Atlantic and across the Rio Grande have been more consistent, but with much lower volume.
Volumes into both the Great Lakes and North Atlantic regions declined in the second half of 2015 and since then have had a slowly increasing trend. In the single month of April, the volume into the Great lakes was the highest in the three years and four months considered.
Volume into the South Pacific ports of San Diego and Los Angeles collapsed in the second half of 2015, recovered through July 2017, but since then they have been erratic. Volume into the North Pacific ports has been much lower and more consistent.
Executive-level subscribers can upgrade to Premium-level content by emailing info@SteelMarketUpdate.com or calling 772-245-8630.


