

Prices

July 13, 2018
SMU Imports Report: HDG Down 10.9 Percent
Written by Peter Wright
Imports of hot-dipped galvanized sheet into the U.S. as a whole were down by 10.9 percent year to date through May, according to Steel Market Update’s latest analysis of Commerce and ITC data.
SMU now has a comprehensive series of import reports ranging from the first look at license data to the very detailed look at volume by district of entry and source nation. The report you are reading now is designed to plug the gap between those two. Our intention is to report regional imports for two products each month. This month (July), we are reporting on coated products. Next month, we will report on HRC and CRC, and in September on coiled and CTL plate.
![]() National level import reports do a good job of measuring the overall market pressure caused by the imports of individual products. The downside is that there are huge differences when the analysis is performed by region.
National level import reports do a good job of measuring the overall market pressure caused by the imports of individual products. The downside is that there are huge differences when the analysis is performed by region.
Figure 1 shows the year-to-date tonnage of HDG imports for each of seven regions. The Great Lakes received the most tonnage with 36.7 percent of the total followed by the Gulf with 28.2 percent. The whole Pacific coast, from San Diego to Anchorage, only received 10.1 percent.
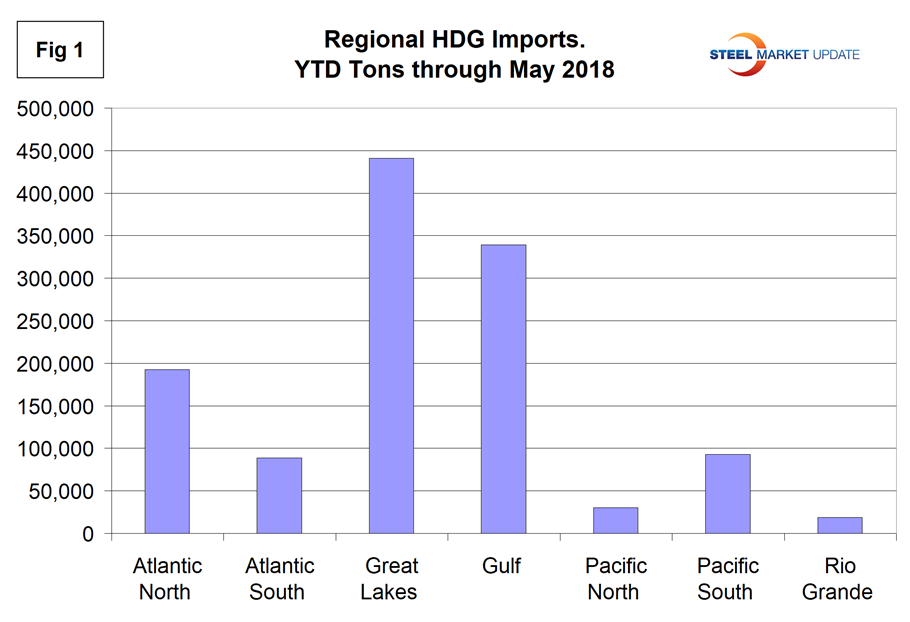
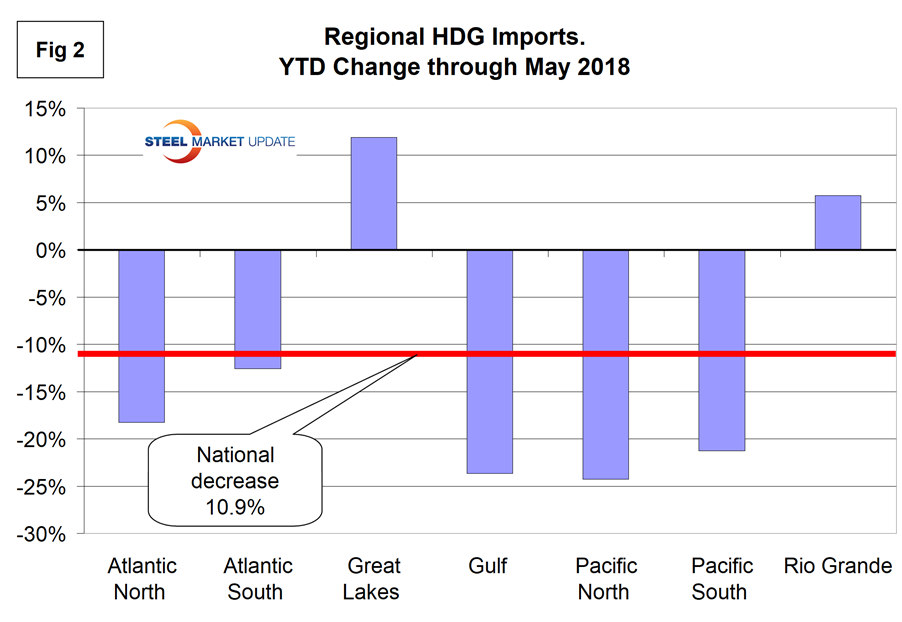
Figure 2 shows the percentage change in tonnage for each region compared to the same period last year and the change at the national level. Five regions had a year-over-year contraction and two had an increase.
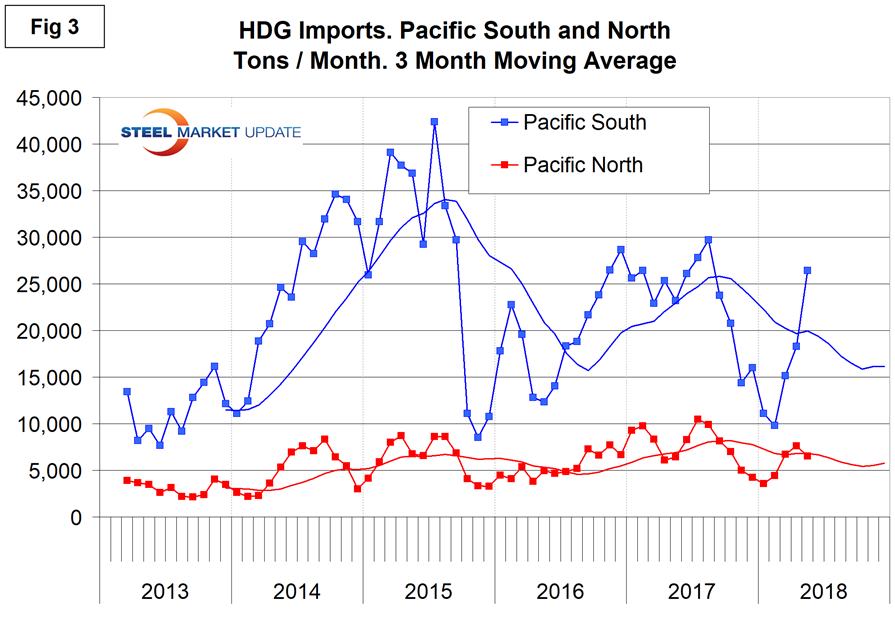
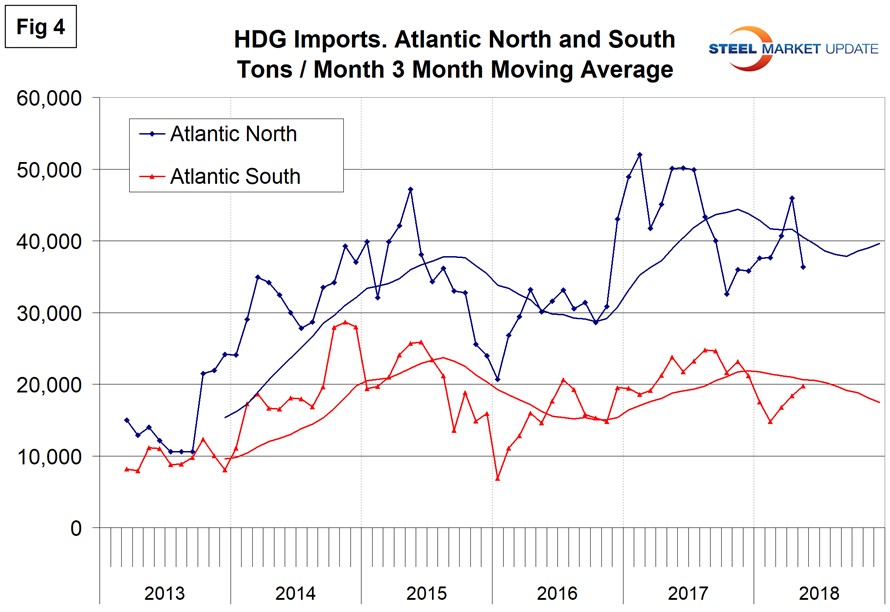
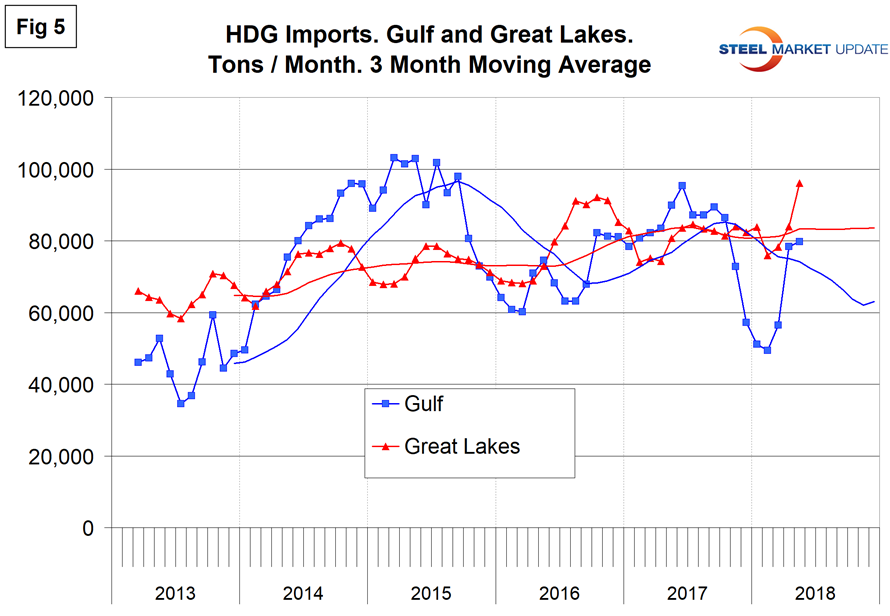
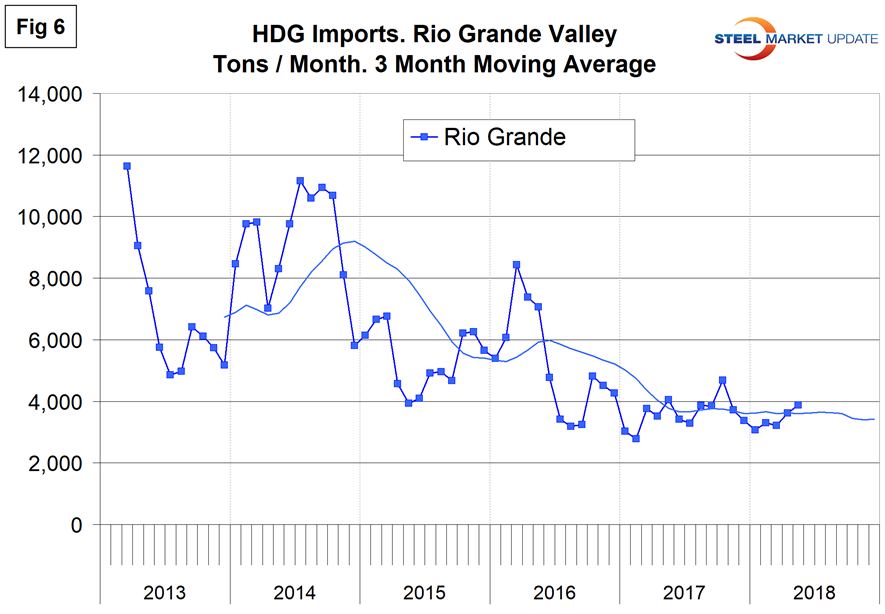
Figures 3, 4, 5 and 6 show the history of HDG sheet imports by region since March 2013 on a three-month moving average basis with a computer driven trend projection through the end of the year.
Volume into the South Pacific ports of San Diego and Los Angeles collapsed in the second half of 2015, and recovered through July 2017, but since then have been erratic. Volume into the North Pacific ports has been much lower and more consistent.
Volume into the Atlantic North collapsed by 74.7 percent in May when compared to April, the tonnage into Baltimore was down by 75.5 percent and into Philadelphia down by 83.9 percent. These extreme changes were masked by the three-month moving average basis of Figure 4.
The Gulf and Great Lakes have both experienced an increase in tonnage in March, April and May on a three-month moving average basis. Again, using this average masks the huge spike that entered Houston in April and which evaporated in May. The April tonnage into Houston was the highest of any month included in this analysis since January 2013.
Tonnage crossing the Rio Grande has been quite consistent for over two years, but in the longer time frame has been drifting down.
Sources: Information in this report has been compiled from tariff and trade data from the U.S. Department of Commerce and the U.S. International Trade Commission.


