

Market Data
August 9, 2018
SMU Steel Buyers Sentiment Index: Optimism's a Bit Wobbly
Written by Tim Triplett
Data from Steel Market Update’s latest market trends questionnaire shows industry sentiment—while still high by historical standards—wobbling a bit, mostly likely over concerns about the uncertain trade situation in the U.S.
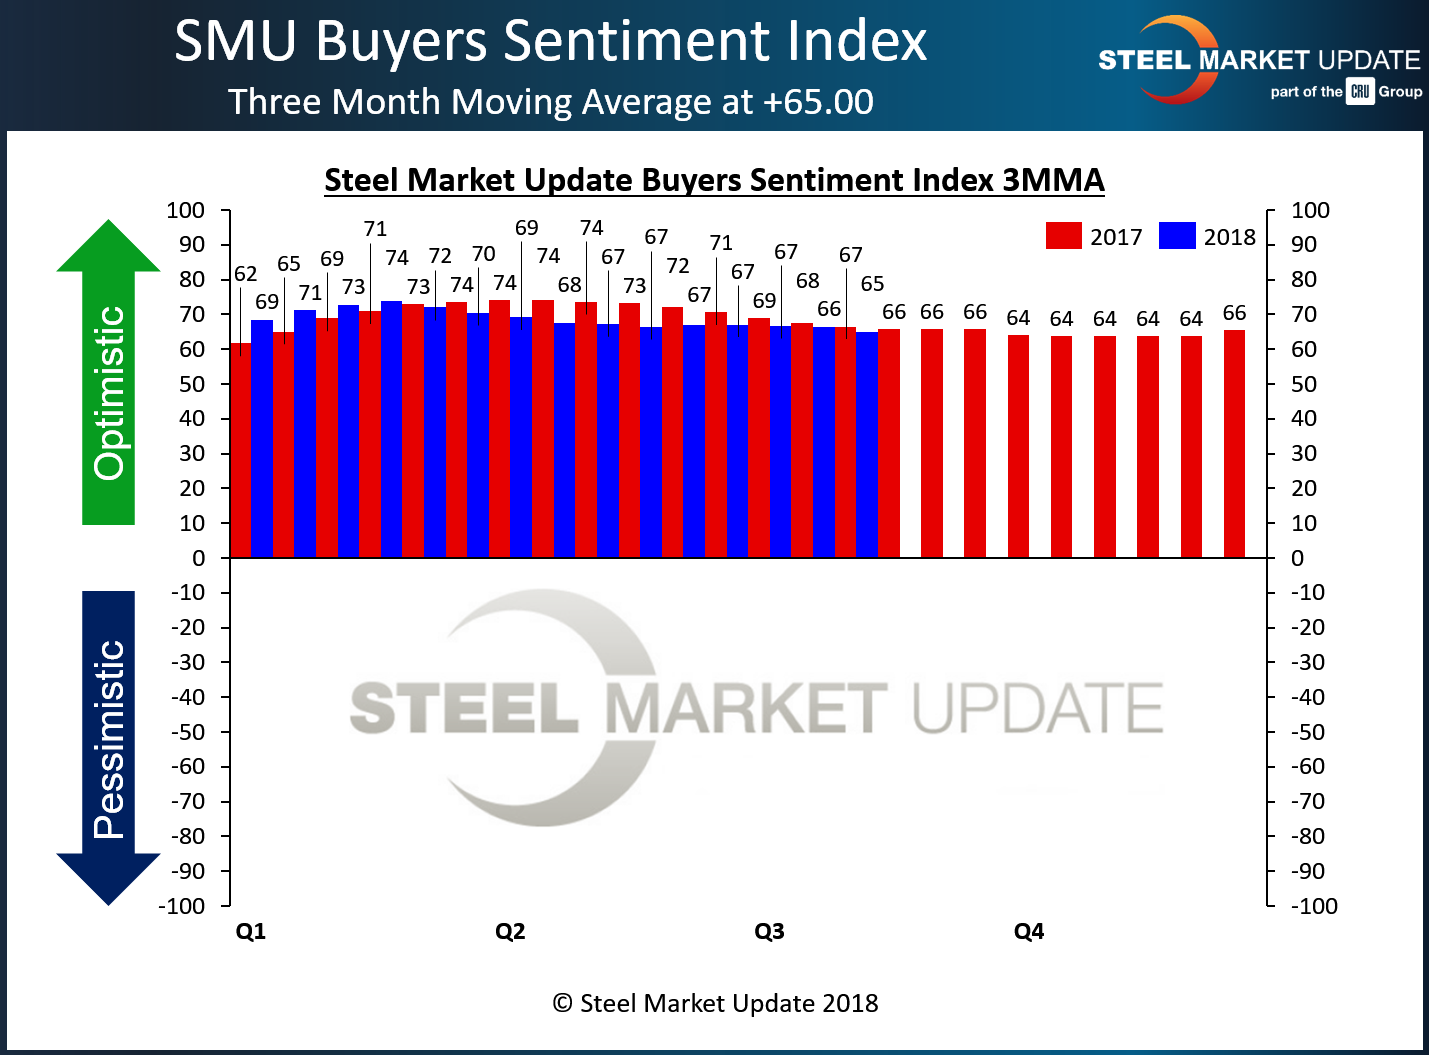
SMU’s Current Steel Buyers Sentiment Index measures how buyers and sellers of flat rolled and plate steel feel about their company’s ability to be successful in the “current” market environment. The index registered +65 out of a possible +100 this week, down 1 point from mid-July and relatively unchanged for the past three months. Calculated as a three-month moving average (3MMA) to smooth out the data, the Current Sentiment index dipped further to +65.00, down from +66.33, and hit the lowest reading of the year. The Current Sentiment Index continues to be optimistic, but well below the 3MMA peak of +73.83 in mid-February.
Future Steel Buyers Sentiment Index
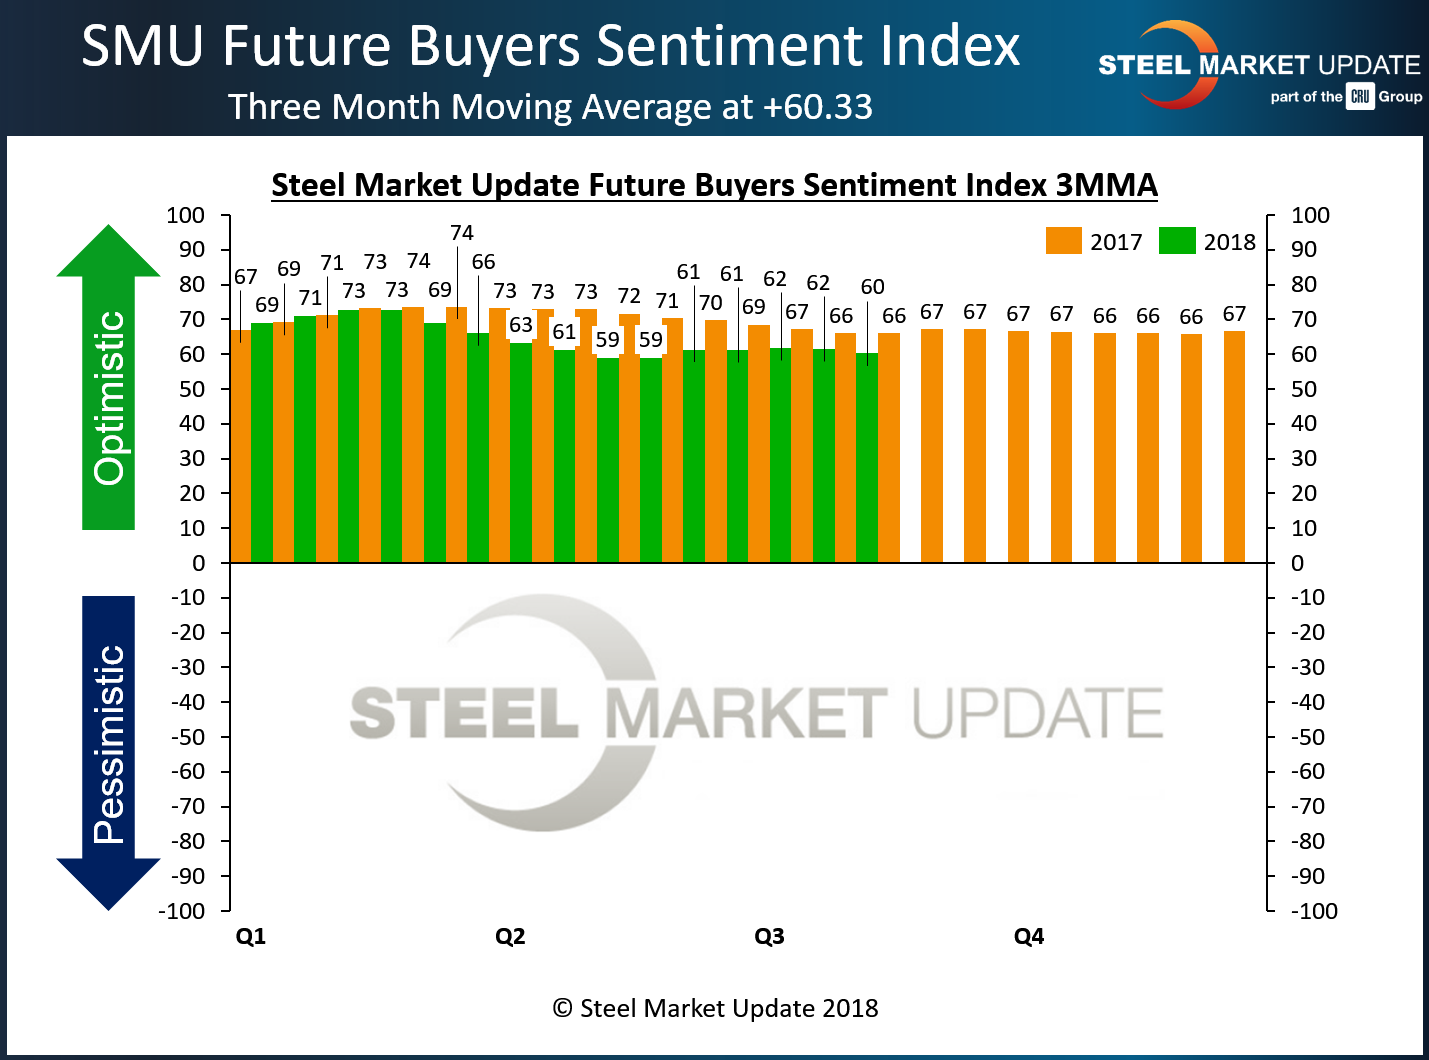
There was a more significant shift in Future Sentiment, how buyers and sellers of flat rolled and plate steel view their company’s ability to be successful three to six months in the future. Future Sentiment measured as a single data point dipped by 8 points in the past two weeks to +55. The 3MMA for Future Sentiment inched down to 60.33 from 61.50 two weeks prior. The Future Sentiment Index remains relatively stable, but at levels well below this point last year.
What Respondents are Saying
- “I see troubled waters next year.”
- “There’s too much uncertainty and signs that trade wars will negatively affect trade flows and overall business levels globally.”
- “I’m worried about the RV market. It is a little slower than usual. That is normally a good indicator of where the economy could be heading.”
- “Steel tariffs are affecting the bottom line due to industry failure to raise pricing quickly enough to compensate.”
- “Uncertainty of the tariff situation and tactical marketing by the domestic mills makes us a little leery!”
- “The balance of this year seems flat to down, but too much trade uncertainty weighs heavy on any positive growth and opportunities.”
About the SMU Steel Buyers Sentiment Index
SMU Steel Buyers Sentiment Index is a measurement of the current attitude of buyers and sellers of flat rolled steel products in North America regarding how they feel about their company’s opportunity for success in today’s market. It is a proprietary product developed by Steel Market Update for the North American steel industry.
Positive readings will run from +10 to +100 and the arrow will point to the righthand side of the meter located on the Home Page of our website indicating a positive or optimistic sentiment. Negative readings will run from -10 to -100 and the arrow will point to the lefthand side of the meter on our website indicating negative or pessimistic sentiment. A reading of “0” (+/- 10) indicates a neutral sentiment (or slightly optimistic or pessimistic), which is most likely an indicator of a shift occurring in the marketplace.
Readings are developed through Steel Market Update market surveys that are conducted twice per month. We display the index reading on a meter on the Home Page of our website for all to see. Currently, we send invitations to participate in our survey to more than 600 North American companies. Our normal response rate is approximately 110-150 companies. Of those responding to this week’s survey, 33 percent were manufacturers and 54 percent were service centers/distributors. The balance was made up of steel mills, trading companies and toll processors involved in the steel business. Click here to view an interactive graphic of the SMU Steel Buyers Sentiment Index or the SMU Future Steel Buyers Sentiment Index.


