

Prices

August 17, 2018
Flat Rolled Imports by District of Entry, Source - June 2018
Written by Peter Wright
This analysis breaks down the imported tonnage of six flat rolled products into the district of entry and the source country. We believe that misinformation (or lack of) about local import volumes is often used to influence purchase decisions. Our intent with this analysis is to describe in detail what is going on in a company’s immediate neighborhood and thus provide a negotiating advantage for our premium subscribers.
![]() Premium members will find reports here on our website that break down the import tonnage through June into the port of entry and country of origin in metric tons. Products analyzed in this way are HRC, CRC, HDG sheet, OMC sheet, CTL plate and coiled plate. This data set is large; therefore, we will make no attempt to provide a commentary. Each reader’s interest will be different and he or she simply needs to select one of the six products, then find the nearest port or ports of entry to see how much came into their locality each month and from where. Monthly data is provided back to January 2015. It is clear from these detailed reports that the change in tonnage entering a particular district in many cases is completely different from the change in volume at the national level.
Premium members will find reports here on our website that break down the import tonnage through June into the port of entry and country of origin in metric tons. Products analyzed in this way are HRC, CRC, HDG sheet, OMC sheet, CTL plate and coiled plate. This data set is large; therefore, we will make no attempt to provide a commentary. Each reader’s interest will be different and he or she simply needs to select one of the six products, then find the nearest port or ports of entry to see how much came into their locality each month and from where. Monthly data is provided back to January 2015. It is clear from these detailed reports that the change in tonnage entering a particular district in many cases is completely different from the change in volume at the national level.
Here are some examples to illustrate why this information can be actionable: Total coiled plate imports in June year to date were up by 21 percent. New Orleans received 129,000 tons in 2016 and 13,000 tons in 2017, but has been completely shut out in the first half of 2018. Total cold rolled coil imports were down by 23 percent in June year to date, but San Francisco was up by 643 percent, almost all that 2018 tonnage being from Vietnam. Total other metallic coated, which is mainly Galvalume imports, were down by 25 percent, but Tampa was up by 93 percent and Chicago was down by 55 percent. The discrepancy between the change at the national and local levels is why we think it’s important for both market understanding and negotiating position to know what’s going on in your own backyard.
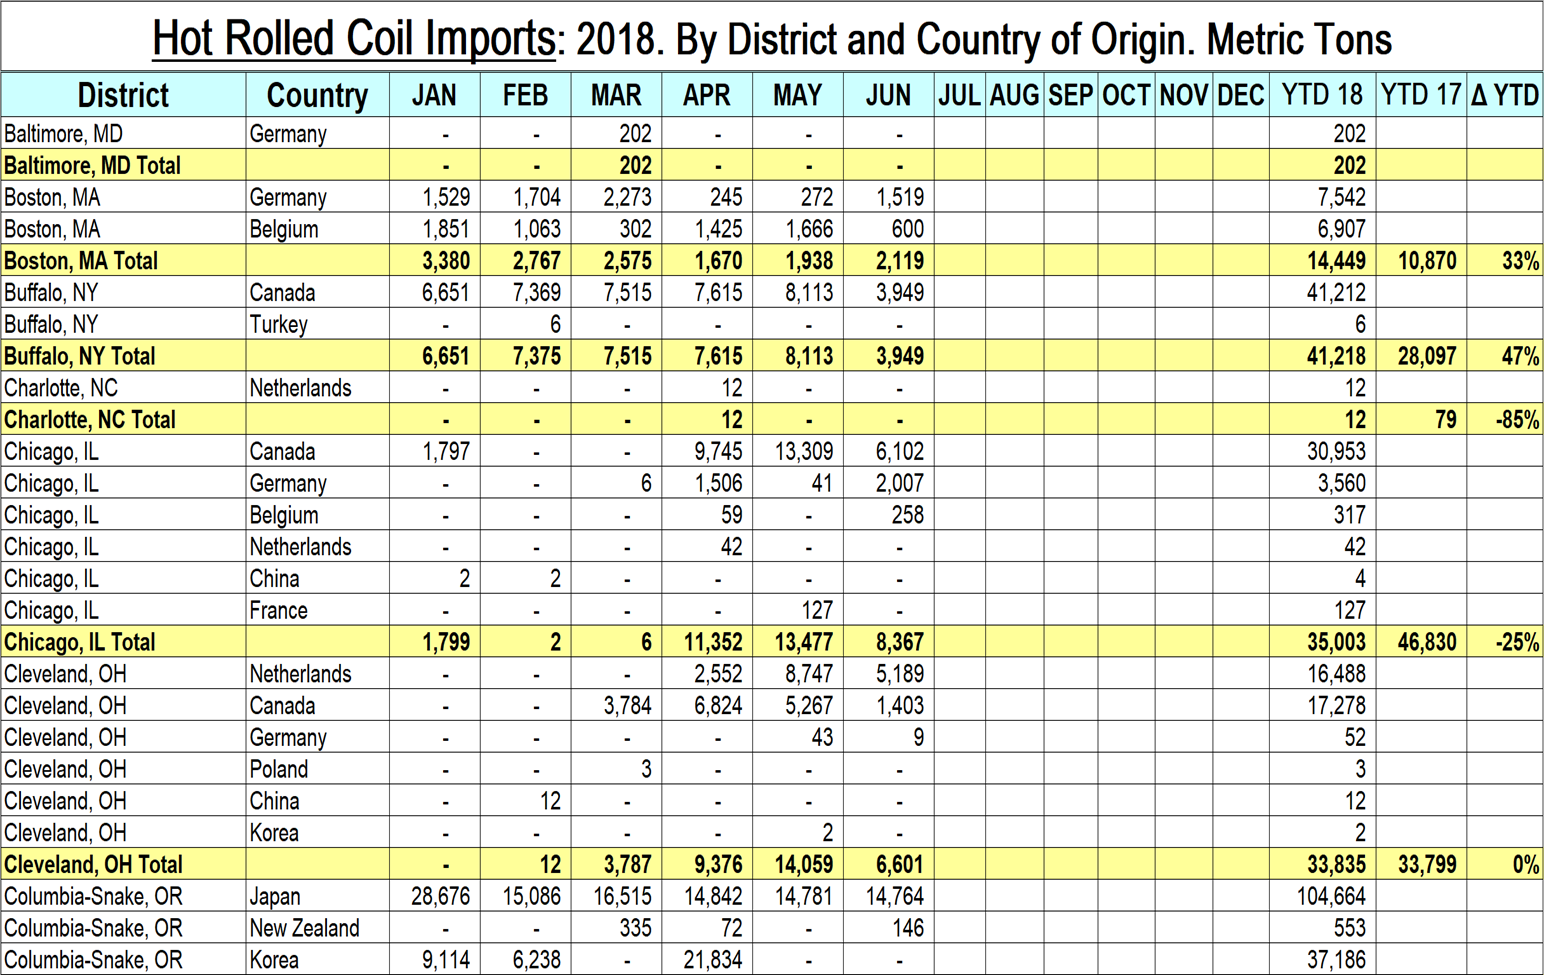
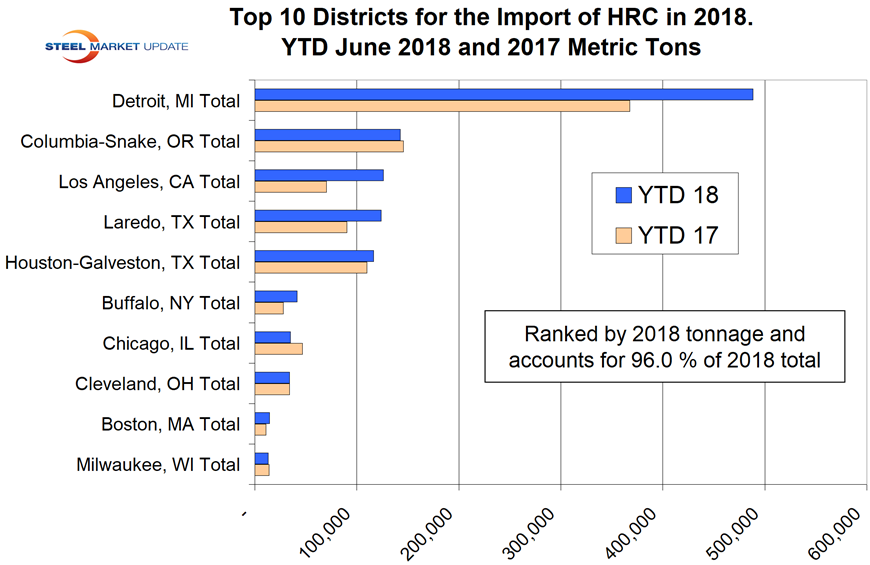
The table included here is a small part of the detailed analysis of the hot rolled sheet tonnage. The bar graph shows the tonnage of hot rolled that entered the top 10 districts in June year to date for 2017 and 2018 ranked by 2018 tonnage. Detroit had the most volume in 2018 and was up by the most year to date.
We are now also producing reports for the same six flat rolled products that consolidate the district reports into seven regions. These reports are even more dramatic in highlighting the differences between the change in import volumes at the national and local levels.
The data in these detailed reports is compiled from tariff and trade data published by the U.S. Department of Commerce and the U.S. International Trade Commission. Our national level import reports are sourced from U.S. Department of Commerce, Enforcement and Compliance, aka the Steel Import Monitoring System. In the development of these reports by district and source country, we have discovered that the SIMA data for HRC and CRC contains some high-alloy steels such as stainless and tool steel, which have been misclassified at the ports. These alloy steels are not included in our detailed reports, which results in a small discrepancy between the two data sets, for CRC in particular and for HRC to a lesser degree.


