Plate
October 15, 2019
Steel Import Market Share for Sheet, Plate, Long, Tubular Products
Written by Peter Wright
February was the first month for the import market share of total steel products, including semifinished, to fall below 20 percent since August 2009. The import share remained below 20 percent through August 2019 when it was 18.4 percent. Our data goes back to January 2003 in which time period the high import share was 38.8 percent in January 2015.
![]()
This report examines the import share of sheet, plate, long and tubular products and 16 subcategories. Table 1 shows total supply to the market in three months through August and in 12 months through August for the four product groups and the 16 subcategories. Supply to the market is the total of domestic mill shipments to domestic locations plus imports. It shows imports on the same three- and 12-month basis and then calculates import market share for the two time periods for 16 products. Finally, it subtracts the 12-month share from the thee-month share and color codes the result green or red. If the result of the subtraction is positive it means that import share is increasing and the code is red. The big picture is that import market share declined in three months compared to 12 months for total sheet, plate products and long products and increased for tubular products.
There is a huge difference in import market share between products with each of the tubular products and coiled plate being the worst cases. See note below about tubular products.
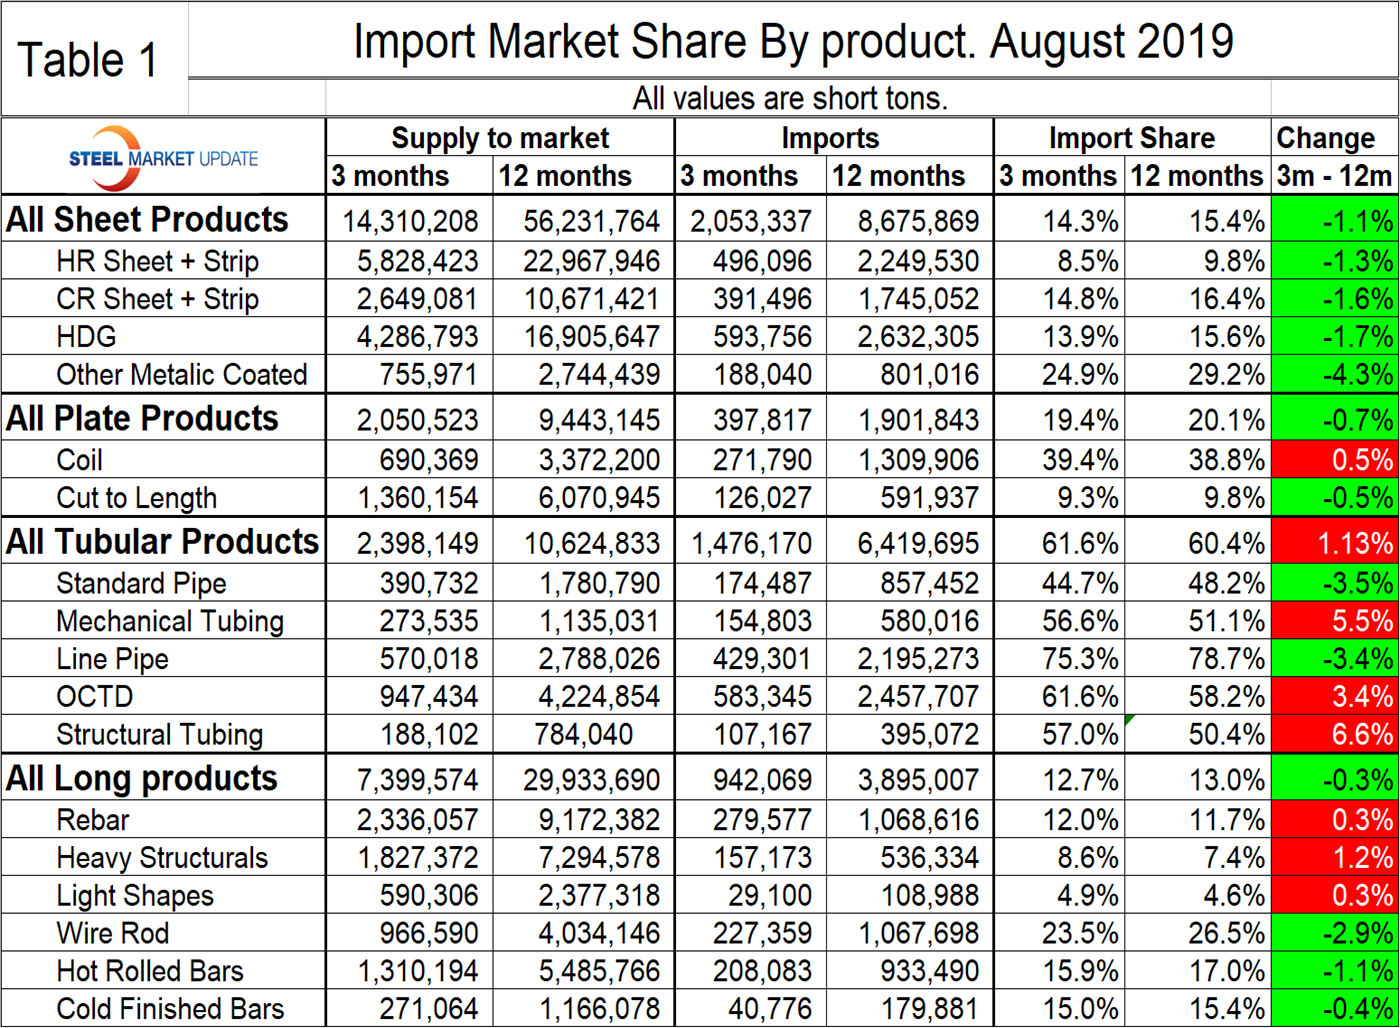
Figure 1 shows the historical import market share of plate and total sheet products. The import share of plate has been decreasing erratically for four years. There has been a downward drift of sheet product import share for the last two years.
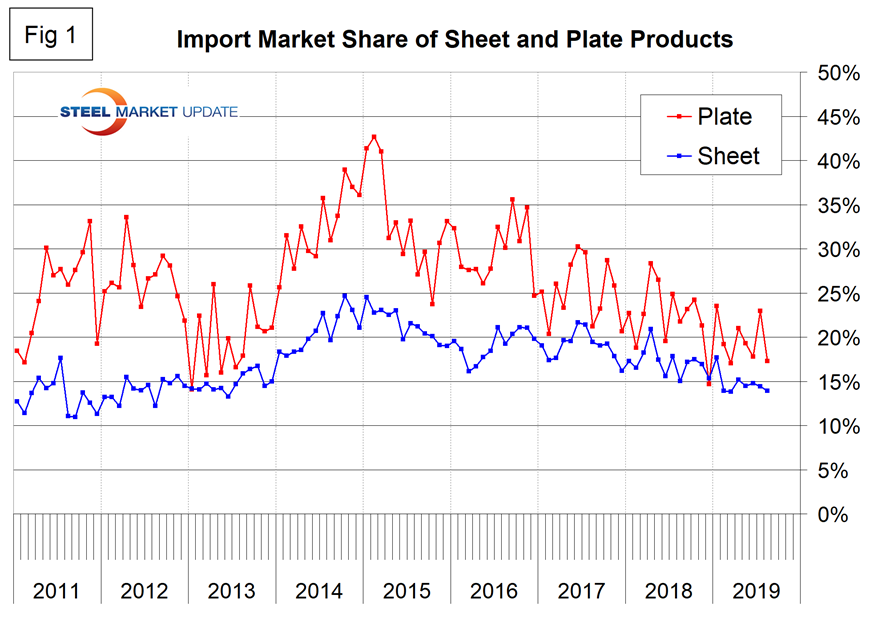
Figure 2 shows the import market share of the four major sheet products. Other metallic coated (mainly Galvalume) has traditionally had by far the highest import market share, but the gap has been closing since late 2017. For the last three and a half years hot rolled coil has had the lowest import market share of the major sheet products.
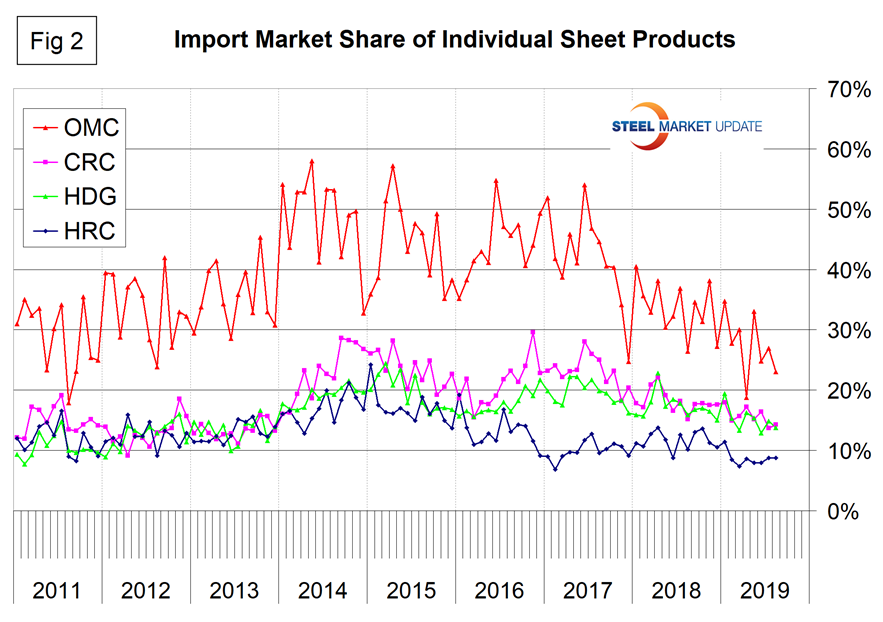
Figure 3 breaks out coiled and CTL plate from the flat rolled total and shows that coil imports currently have almost four times the market share as CTL imports.
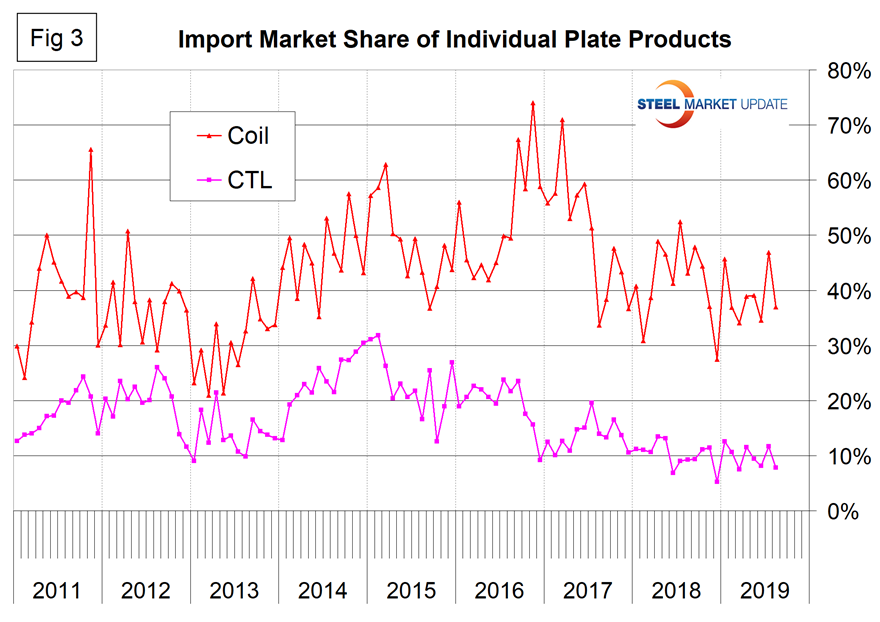
Figure 4 describes the total import share of tubular goods and long products. It is evident that data for the domestic production of tubulars is greatly understated. This is probably because of a more fragmented supply chain and the independent tubers not reporting to the extent that the steel mills do for other products. This has the result of increasing the apparent import market share. In the 12 months prior to and including August the import market share of long products has been historically low.
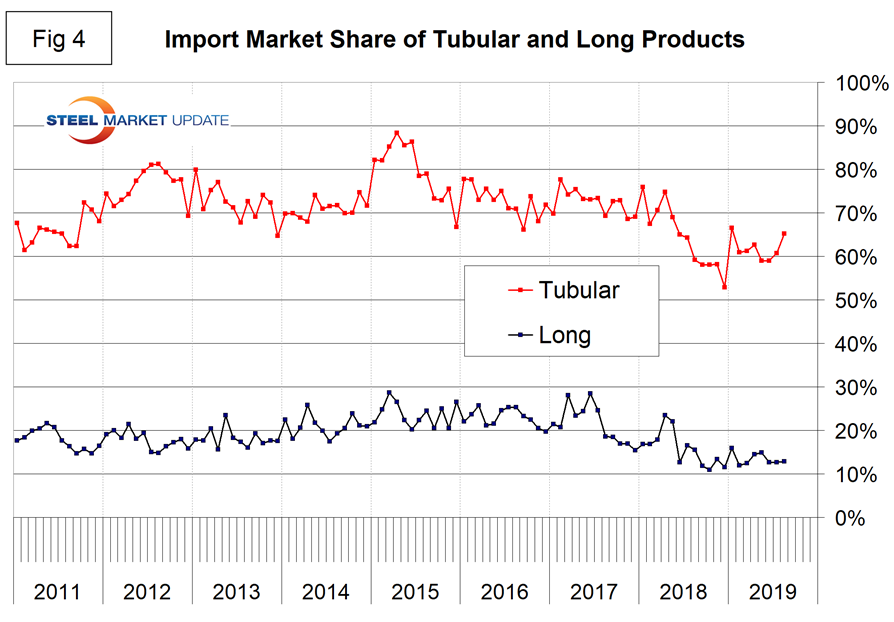
Figure 5 shows the import market share of the individual tubular products. Based on the available information, all are very high compared to other steel product groups and line pipe is the highest. We are reporting this data even though it’s obvious there are problems in the hope that the error is consistent and the shape of the curves in Figure 5 is useful to industry professionals.
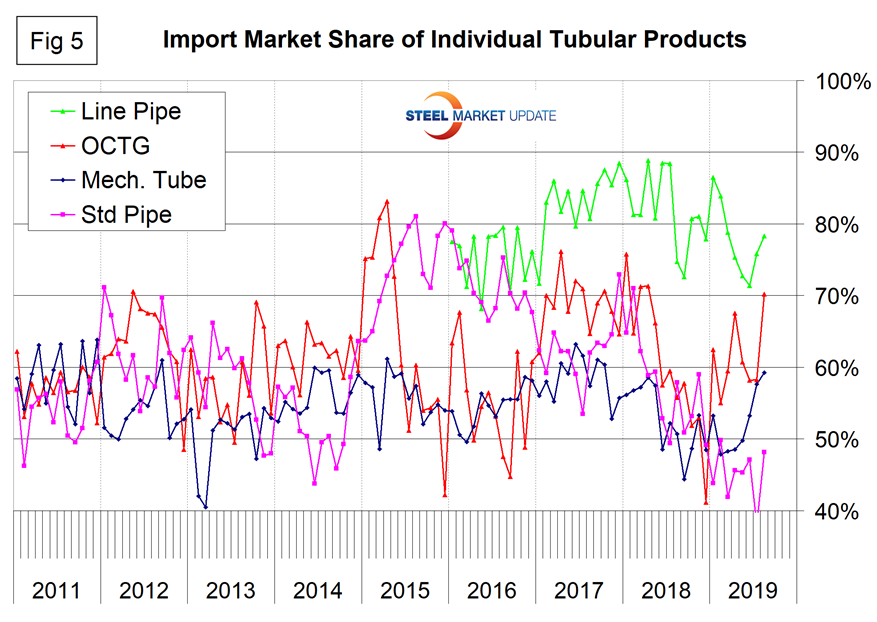
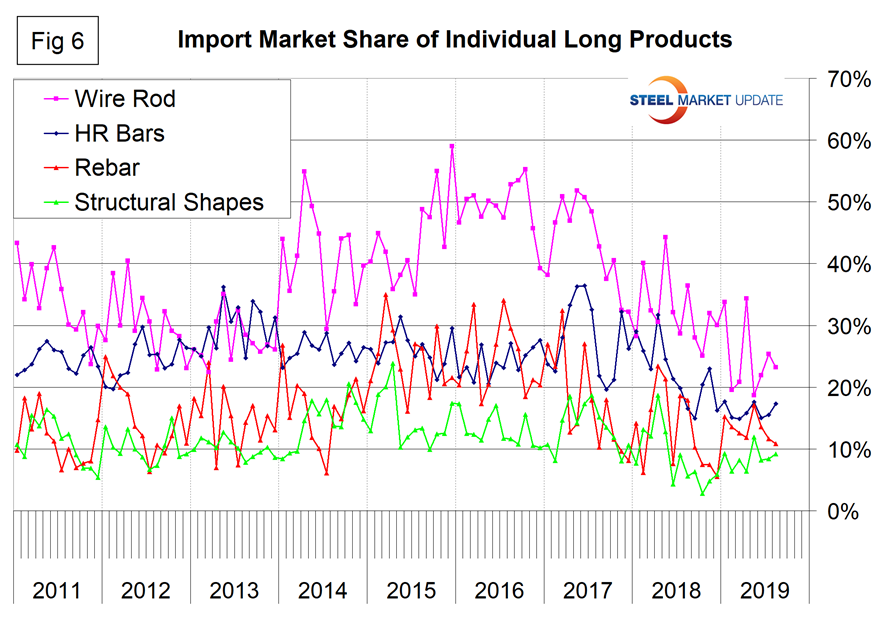
Figure 6 shows the detail for the four major sectors of the long products group. The most significant reduction is for wire rod, which in the years 2014 through most of 2017 had double the import market share of the other long products. In late 2017 the gap narrowed. The import share of hot rolled bars has declined by 50 percent in the 18 months including August 2019. Rebar has been very erratic with no clear trend for two years. The import market share of structural shapes is at the low side of the historical norm.