Market Data

October 23, 2019
China’s GDP Growth Cools to 27-Year Low
Written by Peter Wright
The official economic statistics out of China show a decline in GDP to a level slightly lower than the depths of the global recession in 2009. China’s share of global steel production was 55.9 percent in August.
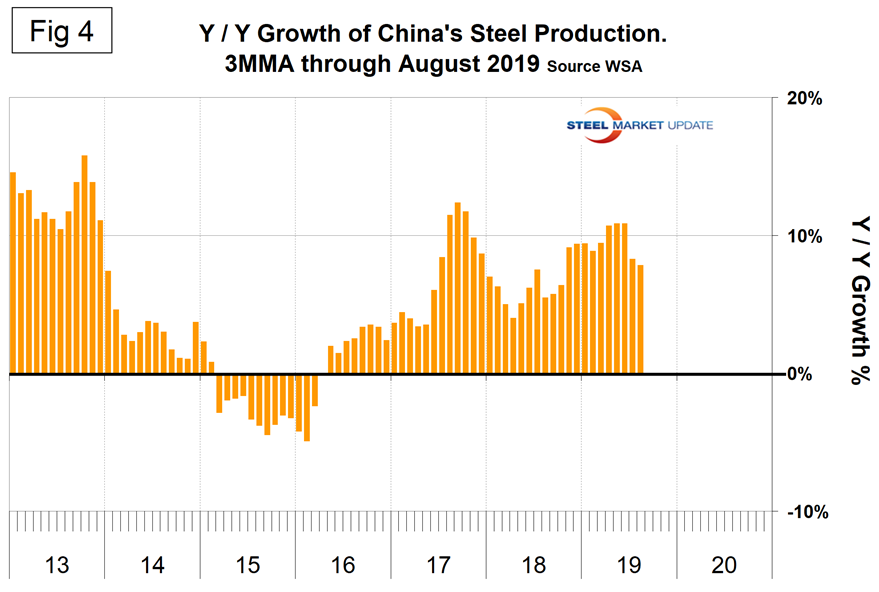
Once each quarter we publish the official statistics for Chinese GDP, industrial production, consumer price inflation and fixed asset investment. We don’t know the accuracy of these numbers, but we include them in our reports because of the importance of China in the global steel scene. China’s economic statistics are never revised, which makes analysts suspicious considering the U.S. routinely makes revisions back decades. Figure 1 shows published data for the third quarter of 2019. The GDP and industrial production portions of this graph are three-month moving averages. China’s GDP grew at a rate of 6.0 percent in the second quarter of 2019, down from 6.8 percent in the first quarter of 2018. Growth has gradually slowed from 9.7 percent in the first quarter of 2011.
On Oct.18, Katrina Ell, an analyst with Economy.com, wrote: “Slower conditions characterized China’s September quarter. GDP growth cooled to 6 percent y/y, its weakest pace in 27 years. This follows 6.2 percent in the June quarter and the 6.6 percent full-year growth of 2018. GDP growth hit 6.2 percent y/y YTD in the third quarter, at the bottom end of the government’s 6 percent to 6.5 percent target range. Comments from the National Bureau of Statistics are notoriously optimistic, but following the third-quarter national accounts data release, NBS spokesman Mao Shengyong noted that the economy faced ‘mounting risks and challenges at both home and abroad.’ Clearly, the likelihood of a rebound is remote, and the government is managing expectations accordingly. The growth of industrial production in the third quarter improved to 5.8 percent from 4.4 percent in Q2, which was the lowest for 17 years.”
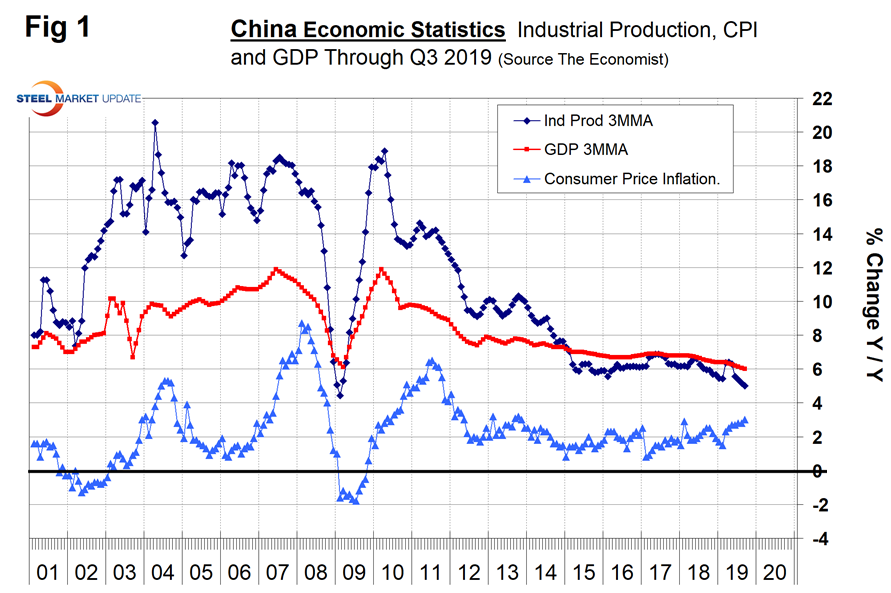
Figure 2 shows the growth of fixed asset investment year over year. Growth was 5.4 percent year over year, which results in a doubling of investment in 13.3 years.
On Oct. 18, Moody’s Analytics wrote: “Fixed asset investment growth in China fell for the third month in a row, ticking down to 5.4 percent from August’s 5.5 percent. Similar to last month, the government picked up part of the slack left by the private sector, which continues to deteriorate during the downturn. By industry, investment in mining remained strong while manufacturing and agriculture continued to be weak. The escalating trade war impacts on investor confidence and planning due to uncertainty on what the landscape of the Asian supply chain will look like once the trade negotiations are done.”
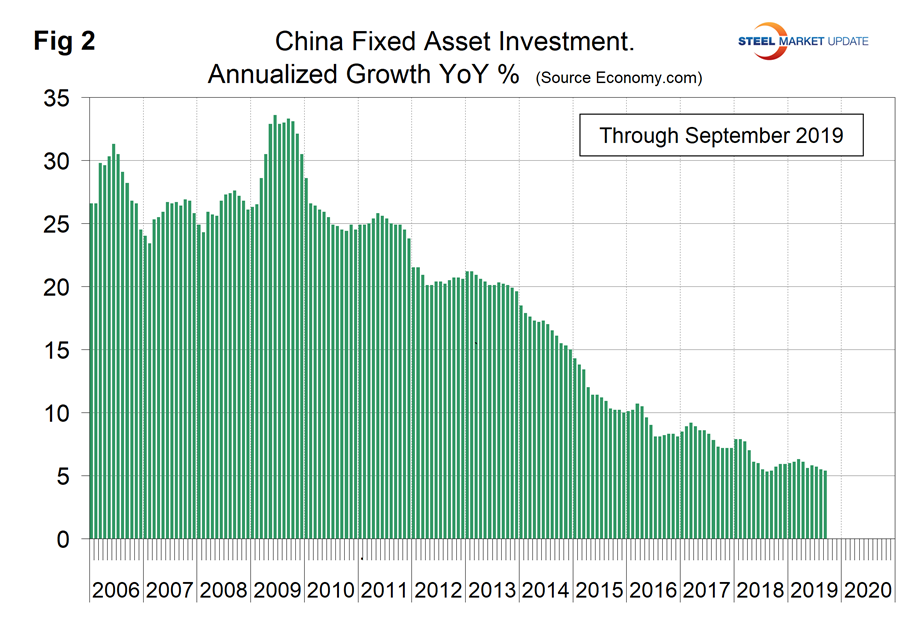
Figure 3 shows the 3MMA of China’s crude steel production through August when it accounted for 55.9 percent of global production. The WSA is forecasting a highly improbable deceleration in China’s steel production growth in 2019.
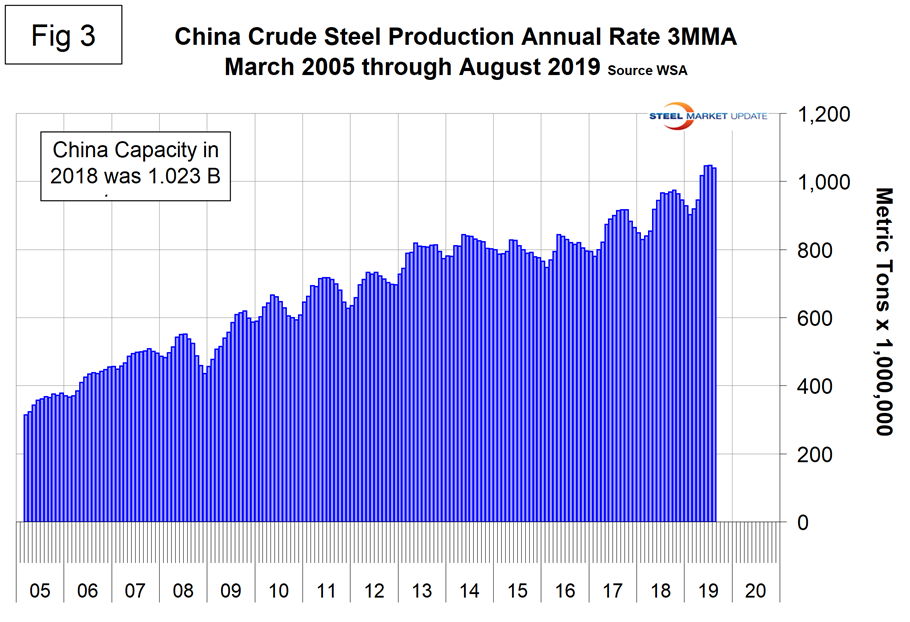
Figure 4 shows the year-over-year growth of China’s steel production. Growth slowed in July and August as the rest of the world experienced a contraction of production.