

Market Segment
November 15, 2019
CRU: How Much Money Does a Steel Mill Need to Make to Survive?
Written by Paul Butterworth
By CRU Research Manager Paul Butterworth
Profitability in the steel industry is highly volatile with the last few years particularly seeing a huge swing in profits. Some producers saw margins hit ten-year highs only to see them quickly fall away, with many becoming loss-making in recent months. As steelmakers navigate the ups and downs of the steel cycle, we investigate the minimum sustainable margin needed by a steelmaker and ask if there is an upper limit to profitability.
U.S. steel consumers are served by both BOF-based integrated mills and EAF-based domestic producers, but the two technologies require different levels of EBITDA to ensure long-term sustainability. For a U.S.-based integrated steel mill, a minimum EBITDA margin of ~7 percent is required through the cycle to provide sufficient cash to ensure the long-term viability of the operation. However, EAF-based producers need only ~4 percent EBITDA margin to be sustainable long-term. The lower EAF value is primarily driven by a lower invested capital intensity that leads to lower on-going capital expenditure requirements and lower borrowing requirements.
Although not analyzed in detail, we believe that the minimum EBITDA margin for European-based steel mills would be slightly higher than for their U.S. counterparts, perhaps by 10-15 percent, whereas for Chinese mills it will be lower. These differences are driven by, in Europe, the lower steel price environment compared with the U.S. and, in China, lower build and financing costs.
Further, our analysis suggests there is a maximum profitability that can be earned by the steel sector given that prices have rarely lifted above the 100th percentile of the cost curve. This implies that there always is, or certainly always has been, enough flexibility in the steel value chain such that production can be increased to take advantage of high prices, and this puts a limit on how far prices, and profitability, can rise.
Surviving Through the Cycle
The steel sector is subject to a cycle during which huge swings in profitability can be exhibited, as capacity takes time to adjust to swings in demand. At the same time, the industry is capital intensive, and invested capital will be, at least partly, funded by debt. As a result, as a minimum, steel companies need to earn sufficient cash through the cycle to fund sustaining capital expenditure (i.e. that needed to keep the assets operating in a safe manner) and to ensure interest payments on any debt can be made, as well as pay corporate taxes. This level of cash generation is, effectively, a cash-neutral situation for the steel mill. EBITDA margin (n.b. Earnings Before Interest, Taxes, Depreciation and Amortization as a percentage of revenue) is a simple and robust financial measure to analyze different companies for this purpose, as it removes distortions seen in other cashflow measures due to the accounting treatment of capital expenditures, depreciation and amortization.
A return to shareholders is not considered within this minimum necessary cash generating requirement. It should also be noted that this minimum cash generation does not allow for development capital expenditure, which may be required in the long term to, at the very least, maintain competitive position with peers or keep up with product quality improvements. Obviously, cash generation over and above the minimum requirement can be used to reward shareholders or for development expenditure, but it is considered that these are not a given.
In order to quantify the minimum sustainable EBITDA margin of a steel mill, we have analyzed the financials of a number of steel companies over time to determine spend in the above areas at different points in the steel cycle.
Further, we apply CRU’s Steel Cost Model to comment on the drivers of maximum profitability achievable in the steel sector, based on historical analysis of prices and costs.
Navigating the Steel Cycle
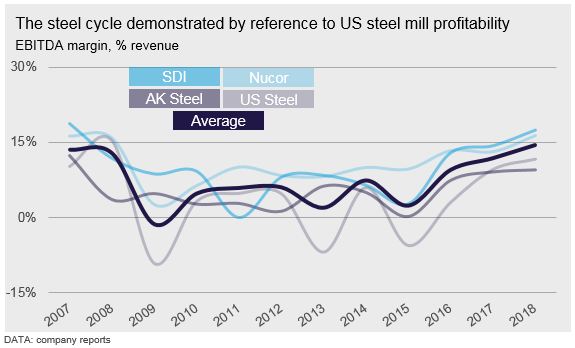
The chart below demonstrates the steel cycle, showing the reported profitability of several U.S. steel companies over the last 13 years or so. At the start of the period, in the lead up to the global financial crisis (GFC) in 2008, profitability was very high, primarily driven by strong growth in steel demand in China and a lagged response from capacity growth. Immediately following the GFC, steel demand and profitability plummeted, but began rising from 2010 onwards, again driven by growth in China, as the government there injected significant stimulus to protect the economy from global weakness. Steel sector profitability remained relatively weak for a number of years before the downturn in 2015 H2 and into 2016, which was perhaps the worst period for the global steel sector since the GFC. Following supply-side reforms in China from 2016 onwards, profitability lifted again from 2017 and remained high through 2018. Since then, profitability has fallen back (n.b. not shown in the chart) and the steel sector appears to be entering another down cycle.
Estimating a Steel Mill’s Non-discretionary Spending
The following analysis looks at capital expenditure, interest and tax payments by company at these different points in the cycle to determine the minimum cash-generating requirement to ensure long term viability.
Capital Expenditure for Sustainable, Long-term Survival
The left-hand chart below shows annual capital expenditure by company, normalized to percentage of revenue for the U.S. mills analyzed (n.b. the revenue potential of a physical asset base, the cost of that asset base and sustaining capex required to maintain the asset base will all be closely linked). This chart shows minimum levels of capital expenditure at U.S. Steel of ~2.5-3.0 percent revenue, which occurred in 2013, 2014 and 2016. AK Steel shows lower minimum levels of capital expenditure, of between 0.7-2.2 percent, which could be related to the less integrated nature of the constituent facilities.
Additionally, these figures may represent capital expenditure that is below the minimum necessary, if they reflect conditions where necessary expenditure is deferred, which can be possible in some cases. Therefore, to take this into account, the higher level of 3.0 percent is considered to be a sustainable minimum for an integrated steel producer without captive raw material supplies.
The right-hand chart below shows data from more companies, including some from outside the U.S. (e.g. Baosteel, POSCO), but this time the capital expenditure is correlated with profitability to demonstrate how capital expenditure is impacted by profitability through the steel cycle.
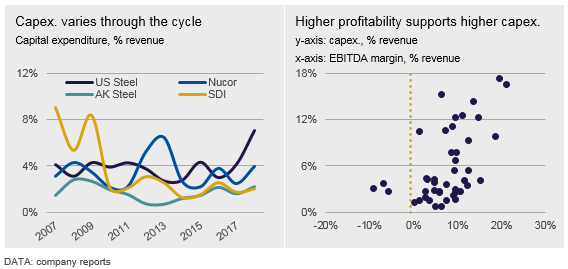
The right-hand chart shows that below ~6-7 percent EBITDA margin, capital expenditure is at a minimum level but, as profitability rises, steel companies are more willing to spend on asset development or to catch up on necessary capital expenditure that has been deferred.
Based on similar financial data for scrap-based EAF operations, minimum levels of capital expenditure are lower, at ~1.5 percent, but it appears they can rise above 2.0 percent when upstream facilities, such as DRI plants, are included in the configuration.
Interest Payments
The left-hand chart below sets out the financing costs for the set of U.S. steel mills analyzed, again normalized to percent of revenue. From this chart we can see that financing costs have, largely, varied between ~1-3 percent of revenue over the period, although some higher levels have been exhibited. However, financing costs should be closely related to the level of gearing and the right-hand chart demonstrates this relationship—that is, as debt as a proportion of total assets rises, so does interest expense as a percentage of revenue.
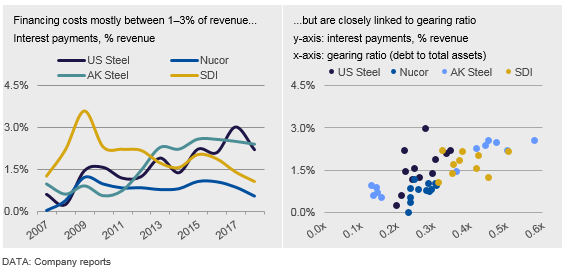
Using the above relationships, we can determine a necessary interest expense at a given gearing ratio to provide a normalized interest expense under given conditions. Thus, for a gearing ratio of 0.35x, the interest expense amounts to ~2.5-3.0 percent of revenue for an integrated company. For EAF operations, this falls to 1.5-2.0 percent. It should be noted that companies may have access to different financing arrangements; nevertheless, we observe a good correlation between interest payments and gearing across the steel industry.
The relationship between interest expense and profitability, referred to as coverage, is a key driver of financing costs because it indicates the ability of a company to meet its future interest payment obligations. Steel mills will have difficulty borrowing to a level where interest expense is more than ~50 percent of profitability, because interest rates charged by lenders become prohibitively high.
Tax Payments
Assuming a steel mill is profitable, then taxes will need to be paid and the left-hand chart below shows the taxes paid by individual companies over the time period analyzed. The right-hand chart plots these tax payments, normalized to percent revenue, versus EBITDA profitability to demonstrate how the level of taxes paid changes with profitability. An obvious relationship perhaps, but one that is useful when determining the sustainable level of profitability, because of the circularity associated with tax payment and profit.
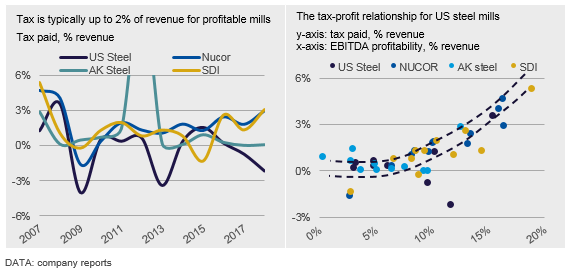
From the right-hand chart we can see that tax payments can vary from -1.0-5.5 percent of revenue across the steel cycle as profit performance changes, but the relationship over that range can be used to determine the level of tax at the minimum sustainable level of profitability, which is set out below.
Minimum Sustainable Level of Profitability for a Steel Mill
The minimum level of capital expenditure and interest expense, as a percentage of revenue, can be determined from the above relationships and, for an integrated steel mill, these equate to 3.0 percent for both measures. Data for the EAF operations analyzed indicates lower figures of 1.5 percent and 2.0 percent (n.b. an EAF operation is less capital-intensive than an integrated BF-BOF operation, as there are fewer assets, therefore, debt levels tend to be lower and the necessary sustaining capital expenditure will be lower). While these figures can be used directly in the determination of minimum sustainable profitability, tax paid varies with profit. As such, the tax level as a percentage of revenue needs to be adjusted such that it is consistent with the overall level of profit implied by the tax level.
This analysis suggests the following levels of necessary expenses for an integrated mill and an EAF mill.

These figures are based on limited data and it might be considered prudent to lift these calculated values, maybe by 1-2 percent, to ensure some headroom in the estimation of a true “minimum sustainable profitability” (e.g. the range of tax paid is one area that introduces some uncertainty).
The Minimum Sustainable Profitability for Europe and China
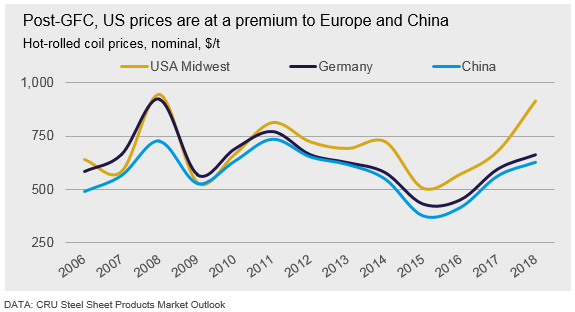
The above analysis has focused on U.S. steel mills and, given that the expenses above have been normalized to a percent revenue measure, for a given asset base, they will be sensitive to steel prices. The chart below shows the indexed price of steel in the U.S., Europe and China over the time period of this analysis and it shows that the U.S. is a premium priced market. As such, for a given asset base and a given build cost, both on-going capital expenditure and interest expense as a percentage of revenue will be lower than equivalent expenses in lower priced regions when normalized to revenue.
An integrated mill in Europe is, to a large extent, not very different from an equivalent mill in the U.S.; the configurations and build costs will be broadly similar. Equally, companies in both regions have access to commercial financing arrangements, and we assume that interest charges in absolute terms will be similar. Therefore, all other things being equal, we would expect the above minimum spend levels, as a percentage of revenue, to be slightly higher in Europe, perhaps by ~10-15 percent, given the steel price differentials. This gives an equivalent minimum sustainable level of profitability of ~8 percent for an integrated mill and up to ~4-5 percent for a scrap-based EAF mill.
In China, although the configuration of an integrated steel mill may not be that different from one in Europe or the U.S., the build cost is very definitely lower (n.b. perhaps by up to 40 percent) and financing costs may very well be lower. Thus, although China has the lowest steel prices, which would imply higher necessary on-going expenses by this measure, we believe this will be more than offset by the lower build and financing costs.
As such, our view is that, by the measure used here (i.e. percent revenue), the minimum sustainable level of profitability is likely to be slightly higher in Europe compared with the U.S., but lower in China.
Is There a Maximum Profitability of the Steel Sector?
The left-hand chart below shows the hot-rolled coil price (n.b. Chinese price) as a percentile on the global cost curve and indicates that, on an annualized basis, steel prices never lift above the top of the cost curve (i.e. above the 100th percentile); this is also true when looking at quarterly prices that are much more volatile. This implies that there always is, or certainly always has been, sufficient flexibility in the steel value chain such that steel production can be increased in a high price environment, perhaps by taking advantage of more expensive inputs. The implication of this is that there is a maximum profitability that can be earned by the steel sector, which is further demonstrated in the right-hand chart below that plots weighted average profitability of the U.S. steel sector against price as a percentile on the global cost curve (n.b. for consistency the right-hand chart uses China prices adjusted using the U.S./China premium to better reflect price movements in the U.S.).
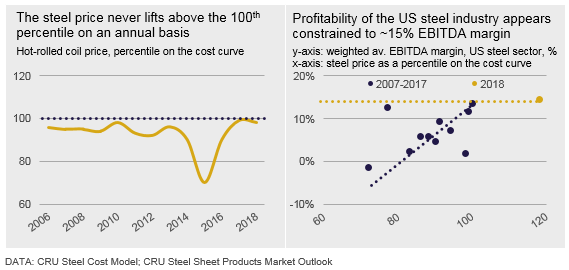
The right-hand chart above separately shows the weighted average profitability of the U.S. steel sector in 2018 (i.e. the yellow data point), following imposition of the Section 232 tariffs when prices lifted to very high levels. In fact, under these conditions, U.S. prices were able to lift above the 100th percentile of the [static] cost curve. Despite this, the weighted average profitability of the industry remained stubbornly at ~15 percent EBITDA margin. Given the high prices, this level of profitability can only imply that underlying costs also increased. That is, that expensive capacity was incentivized to be brought online to take advantage of the high prices, but this had little benefit to the industry as a whole from a profitability perspective. In this regard, the U.S. has served as a good case study for how the industry global responds to high prices in the short term, limiting the profitability upside in a high demand, high price environment. Obviously, there are further implications relating to the ability to reinvest development capital in operations over the long term.
Profitability is Limited by Flexibility in the Steel Value Chain
This analysis suggests that an integrated steel mill in the U.S. or Europe needs to earn a minimum of 7-8 percent EBITDA margin though the cycle (n.b. not including suggested additional headroom of 1-2 percent) to ensure that necessary capital expenditures can be made and that debt-servicing costs and taxes can be paid. For a scrap-based EAF mill, the minimum sustainable level of profitability falls to ~4-5 percent, which we relate to the lower capital intensity of these operations. We expect the minimum levels of profitability to be lower in China, given lower build and financing costs.
Analysis of prices and costs suggests that there always has been enough flexibility in the steel value chain to allow production to increase in the short term in response to very high prices. It is our assertion that this flexibility puts a limit on the level to which prices can rise and, therefore, on the maximum profitability of the industry.

