

Market Data

November 21, 2019
Steel Mill Lead Times: Lengthen by a Week
Written by Tim Triplett
Mill lead times for spot orders of flat rolled steel have lengthened by roughly a week following the mills’ price increase announcements over the past month. Lead times for steel delivery are a measure of demand at the mill level. Thus, this data indicates the mills have gotten busier as buyers step up to place orders ahead of increasing prices.
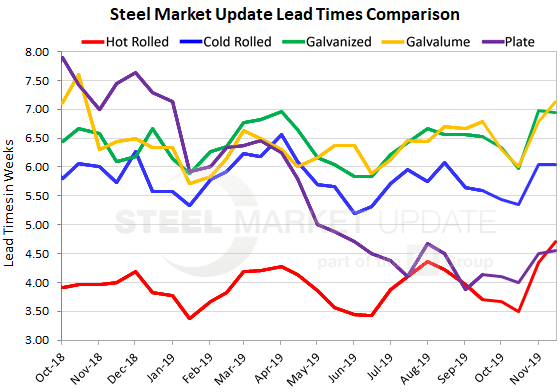
The average lead time for hot rolled steel is now up to more than four and a half weeks, cold rolled is over six weeks and coated steels are around seven weeks. Plate lead times are up to more than four and a half weeks, according to data gathered by Steel Market Update this week.
Hot rolled lead times now average 4.70 weeks, up from 3.50 weeks in mid-October and 4.34 weeks in early November. The average cold rolled lead time has increased to 6.04 weeks from 5.35 weeks a month ago. The average lead time for galvanized over the past month has increased by nearly a week to 6.94 from 5.97 weeks, with little change over the past couple weeks. The average lead time for spot orders of Galvalume is now up to 7.13 weeks. Lead times for spot orders of plate steel have also increased to an average of 4.56 weeks from 4.0 weeks a month ago. Except for plate, lead times for all steel products are now longer than they were at this time last year.
Flat rolled steel producers have announced two $40 price increases, and plate producers one $40 price increase, in the past month, prompting some buyers to move into the market. The benchmark price for hot rolled steel has increased by about 14 percent since mid-October, jumping from around $470 to $535 per ton, according to SMU data.
Note: These lead times are based on the average from manufacturers and steel service centers who participated in this week’s SMU market trends analysis. Our lead times do not predict what any individual may get from any specific mill supplier. Look to your mill rep for actual lead times. Our lead times are meant only to identify trends and changes in the marketplace. To see an interactive history of our Steel Mill Lead Times data, visit our website here.


