Market Data

January 23, 2020
Steel Mill Negotiations: Most Products Continue to See Prices as Somewhat Negotiable
Written by Tim Triplett
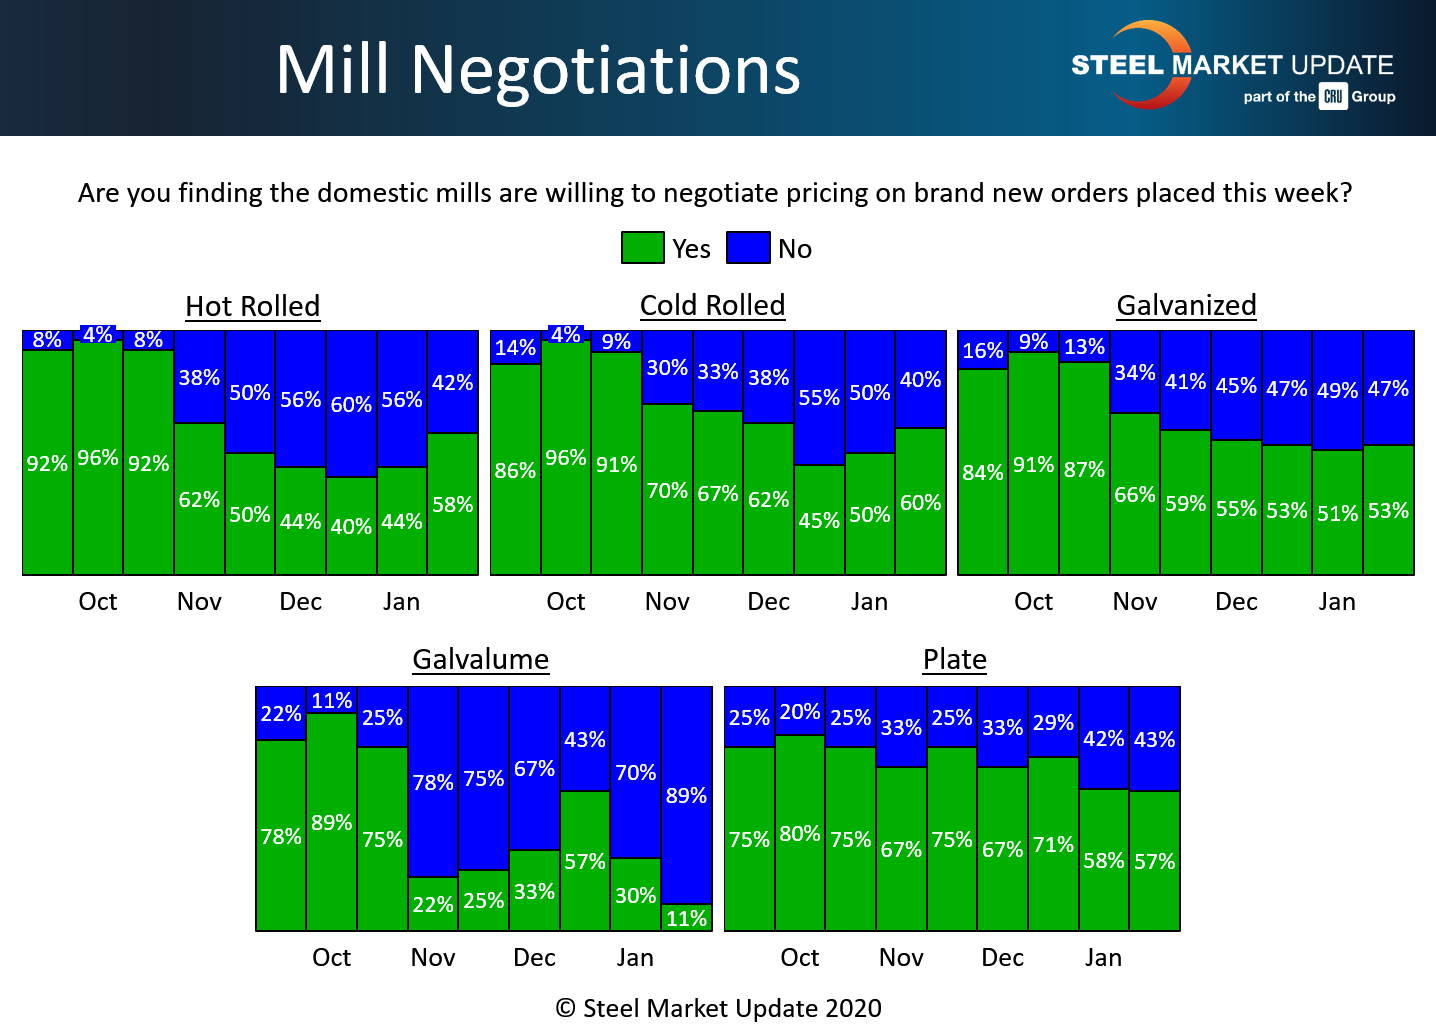
Negotiations between steelmakers and steel buyers on new spot orders appear to have loosened slightly on hot rolled and cold rolled, but not to levels we saw in late 3rd quarter 2019.
In the hot rolled segment, the majority of buyers (58 percent) said the mills are now more willing to negotiate prices on HR, up 14 points from two weeks ago. The percentage reporting mills holding the line on HR decline from 56 to 42 percent.
The cold rolled segment saw a similar, 10-point swing with 60 percent of buyers now reporting mills willing to talk price on CR to win the order.
The change was less pronounced in galvanized where a slightly higher majority (53 percent) of buyers said the mills were flexible in terms of pricing last week. Considerably more Galvalume buyers (89 percent) reported the mills holding the line.
There was little change in plate talks in the past two weeks, as 57 percent reported the plate mills open to negotiations.
Benchmark hot rolled steel prices declined by $20 in the first half of January to an average of $590 per ton, according to SMU’s canvass of the market this week. That dovetails with this negotiations data, which suggests that more mills are discounting to secure orders.
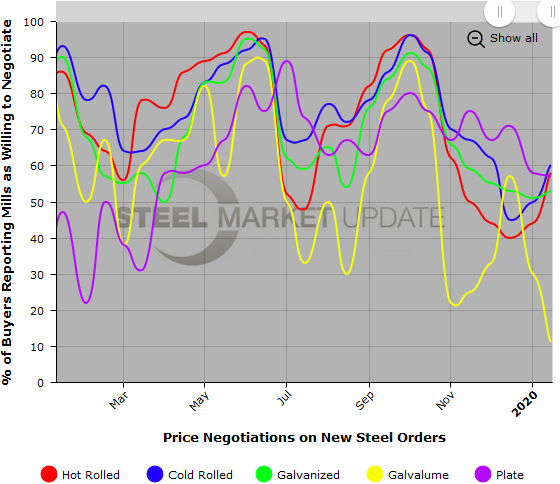
Note: SMU surveys active steel buyers twice each month to gauge the willingness of their steel suppliers to negotiate pricing. The results reflect current steel demand and changing spot pricing trends. SMU provides our members with a number of ways to interact with current and historical data. To see an interactive history of our Steel Mill Negotiations data (example below), visit our website here.