

Market Data
January 31, 2020
High Level of Stability in Consumer Confidence
Written by Peter Wright
The Conference Board report of consumer confidence in January shows stability at a high level based on 10 years of history.
The composite value of consumer confidence in January, reported by The Conference Board, was 131.6 with a three-month moving average (3MMA) of 128.9. The 3MMA has decreased from 132.1 in September, but was up by almost two points in January from 127.0 in December. This indicator is quite volatile, therefore we prefer to use a moving average to reduce monthly variability.
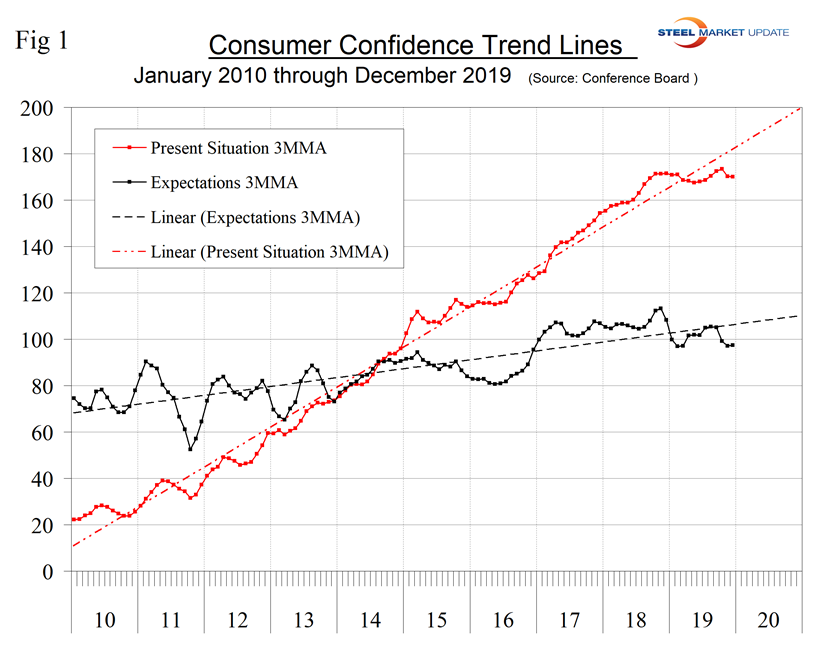
The composite index is made up of two sub-indexes: the consumer’s view of the present situation and his or her expectations for the future. In January, both subcomponents were below the 10-year trend line, but both are at a sustained high level and have changed little in 12 months (Figure 1).
Moody’s Analytics summarized as follows: “Consumer confidence increased in January, but the coronavirus could temporarily weigh on it in February. The Conference Board’s consumer confidence index increased from a revised 128.1 in December to 131.6 in January, better than our slightly above consensus forecast. Consumers’ assessment of present conditions rose from 170.5 to 175.3. Expectations, which are based on consumer’s expectations for income, business and labor market conditions, rose from 100 to 102.5. The cutoff date for the survey was Jan. 15, suggesting that the coronavirus’ potential impact on sentiment could be in February.”
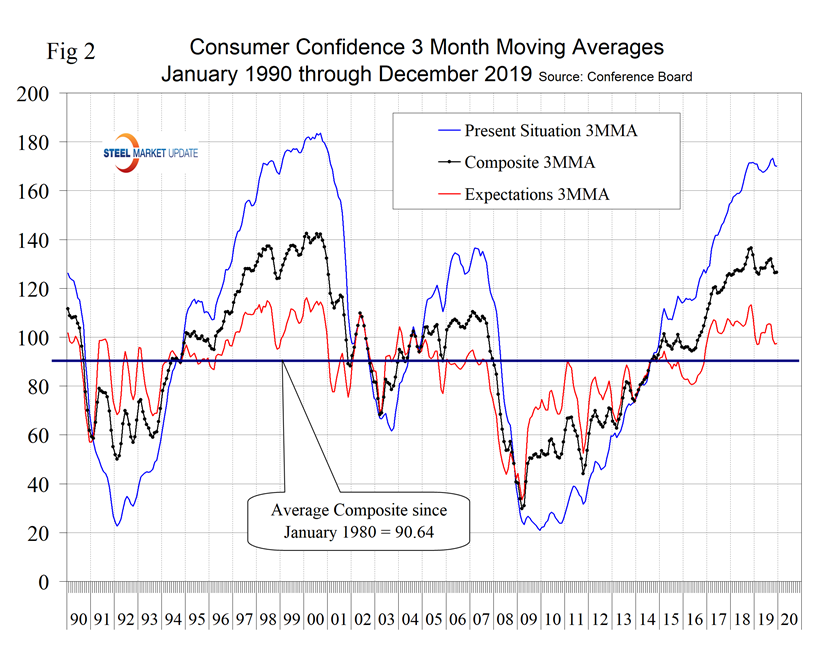
The consumer’s view of the present situation in August 2019 at 176.0 was the highest since November 2000. The January value was 170.8, which was up from 166.6 in November. The 3MMA in January increased from 170.2 to 170.8. The 3MMA of expectations in January was 100.9, up from 98.3 in December, but down from 105.5 in August. The historical pattern of the 3MMA of the composite, the view of the present situation and expectations since January 1990 are shown in Figure 2.
On a three-month moving average basis comparing January 2020 with January 2019, the 3MMA of the present situation was down by 0.1 points and expectations were up by 1.1 points (Table 1). The color codes show improvement or deterioration of the individual components in Table 1. In July and August 2019, the table was all green for the first time since January 2018.
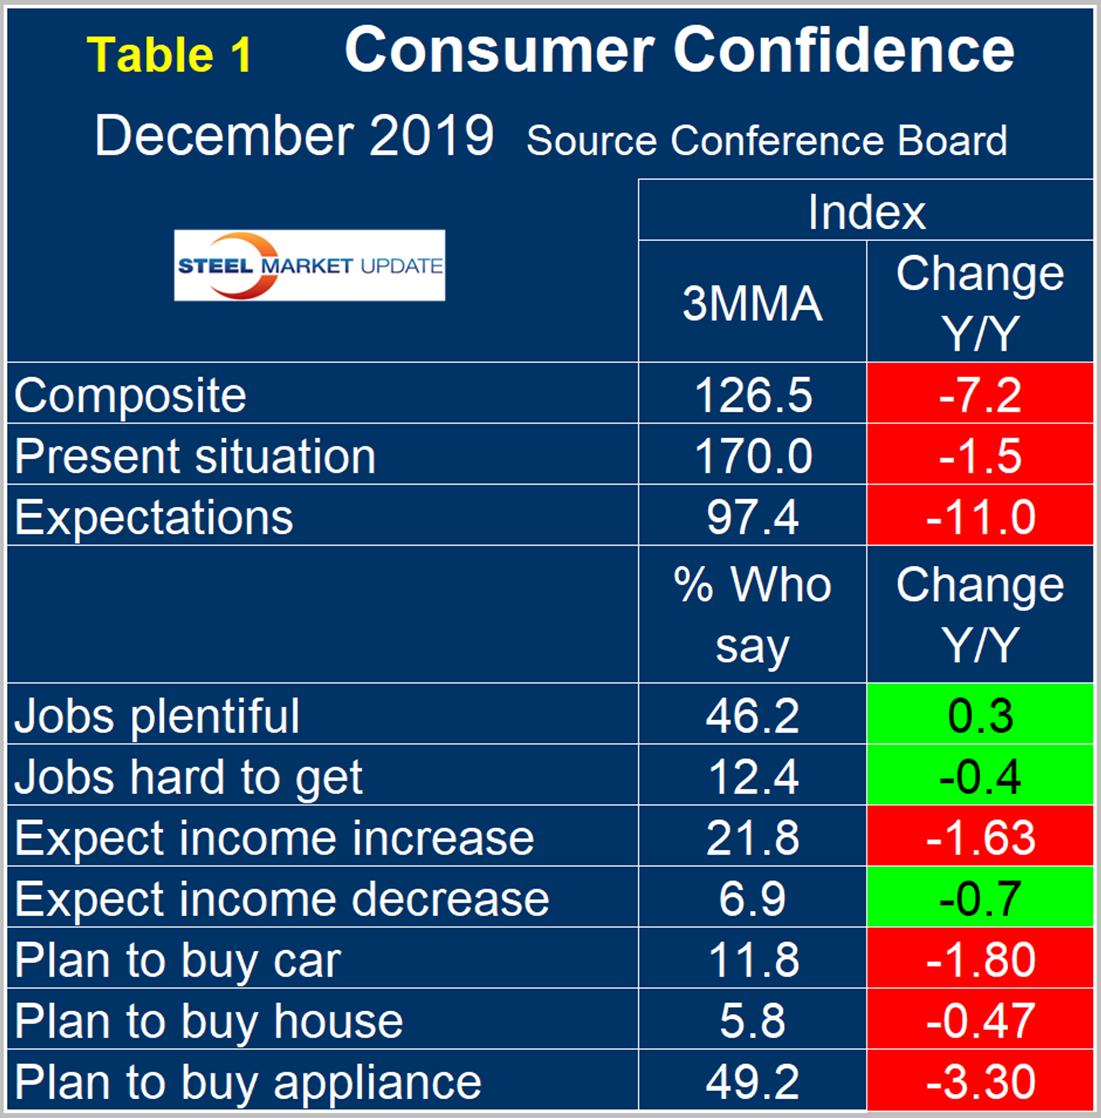
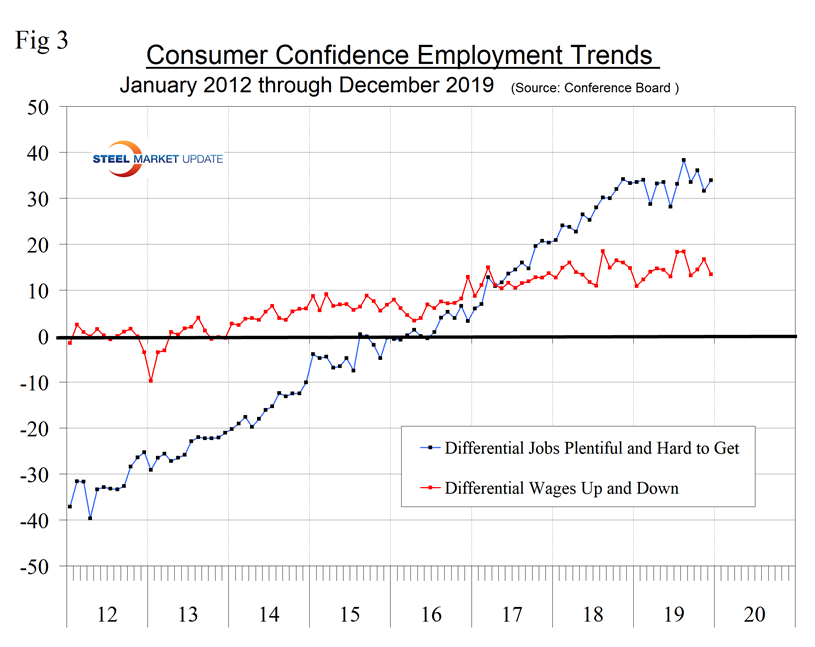
The consumer confidence report includes employment data that continues to be encouraging as 46.5 percent of respondents reported jobs to be plentiful and 12.3 percent reported jobs hard to get. Expectations for wage increases were also positive, with 22.5 percent expecting an increase and 7.2 percent expecting a decrease. Figure 3 shows the differential between the positive and negative statistics for employment and wages.
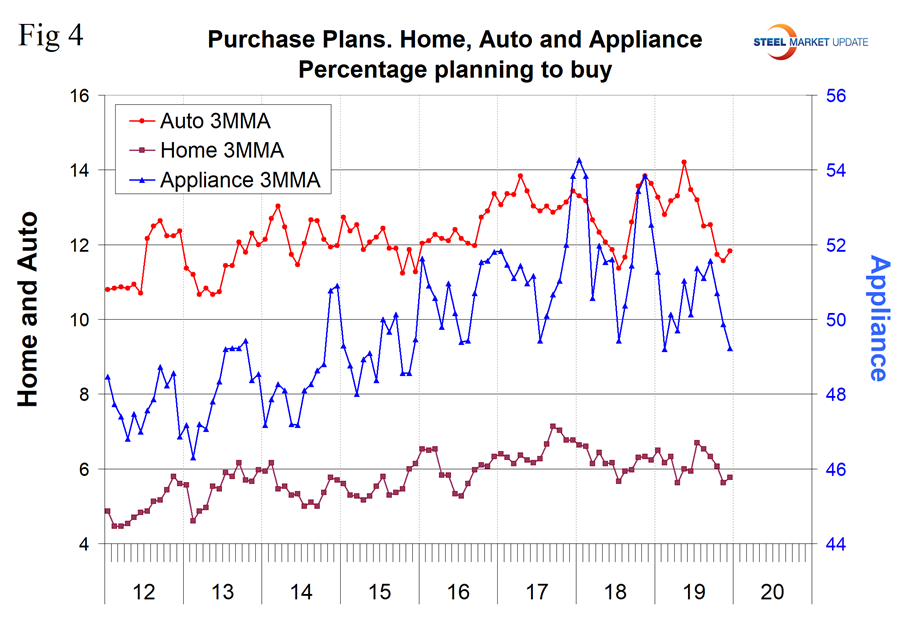
Consumer spending attitudes in January indicated that plans to buy a car, a house or an appliance on a 3MMA basis were all down year over year (Figure 4).
SMU Comment: Both components of the composite Conference Board Consumer Confidence Index are below their 10-year trend line, but are relatively stable at a historically high level. The consumer’s view of the present situation is one of SMU’s recession monitors and shows no sign of a sustained decline. Steel demand is dependent on the growth of GDP, which in turn is strongly influenced by consumer confidence, disposable income and a willingness to spend. Therefore, this is a report that should factor into corporate planning.
About The Conference Board: The Conference Board is a global, independent business membership and research association working in the public interest. The monthly Consumer Confidence Survey®, based on a probability-design random sample, is conducted for The Conference Board by Nielsen. The index is based on 1985 = 100. The composite value of consumer confidence combines the view of the present situation and of expectations for the next six months.


