

Market Data

April 16, 2020
Steel Mill Lead Times: One Week Shorter Since Mid-March
Written by Tim Triplett
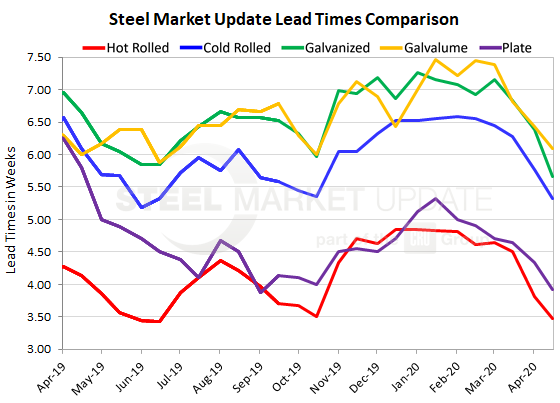
Lead times for spot orders of flat rolled and plate have continued to shorten despite the mills’ efforts so far to curtail production and match supply with demand. Lead times for steel delivery are a measure of demand at the mill level—the shorter the lead time, the less busy the mill. Average lead times for most products have shortened by more than a week since mid-March as the coronavirus has taken its toll on the economy and steel demand, according to returns from Steel Market Update’s latest market trends questionnaire.
Hot rolled lead times now average 3.48 weeks, down from 4.50 a month ago. Cold rolled orders currently have a lead time of 5.32 weeks, down from 6.28. The current lead time for galvanized steel is 5.66 weeks, compared with 6.84, while Galvalume is at 6.09 weeks, down from 6.82 in SMU’s mid-March check of the market.
Lead times for spot orders of plate products now average 3.92 weeks, down from 4.64 weeks in mid-March.
The mills have announced a series of furnace idlings and production cuts that should reduce their near-term capacity and help support lead times at the facilities still in operation, but the data suggests the strategy has not gained much traction yet.
Note: These lead times are based on the average from manufacturers and steel service centers who participated in this week’s SMU market trends analysis. Our lead times do not predict what any individual may get from any specific mill supplier. Look to your mill rep for actual lead times. Our lead times are meant only to identify trends and changes in the marketplace. To see an interactive history of our Steel Mill Lead Times data, visit our website here.


