

Prices

April 30, 2020
Hot Rolled Futures: Ferrous Markets and Stocks vs. Crude - A Widening Gap
Written by Tim Stevenson
SMU contributor Tim Stevenson is a partner at Metal Edge Partners, a firm engaged in Risk Management and Strategic Advisory. In this role, he and his firm design and execute risk management strategies for clients along with providing process and analytical support. In Tim’s previous role, he was a Director at Cargill Risk Management, and prior to that led the derivative trading efforts within the North American Cargill Metals business. You can learn more about Metal Edge at www.metaledgepartners.com. Tim can be reached at Tim@metaledgepartners.com for queries/comments/questions.
We’ve started to see some of the ugly economic data we’ve all been expecting. The Markit U.S. Manufacturing PMI fell to 36.9 vs. 48.5 last month, durable goods orders fell 14 percent, the University of Michigan Sentiment Index dropped to 72, the Dallas Fed index dropped to -74, etc. It’s bad, and the terrible economic numbers will keep on coming for the next weeks/months. So, what is going on with the stock market?
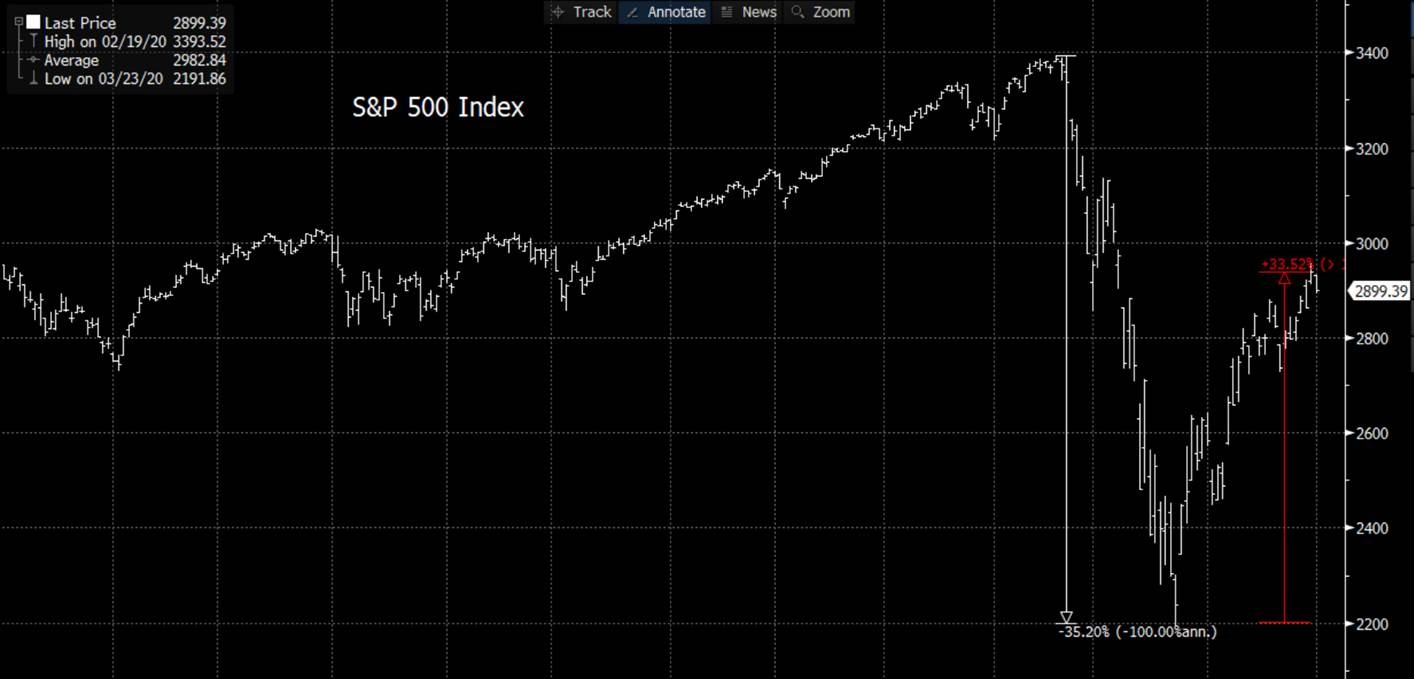
After dropping roughly 35 percent as the virus started really becoming a problem, we’ve regained over half the point drop on the S&P with a vicious rally since late March. What is the market seeing?
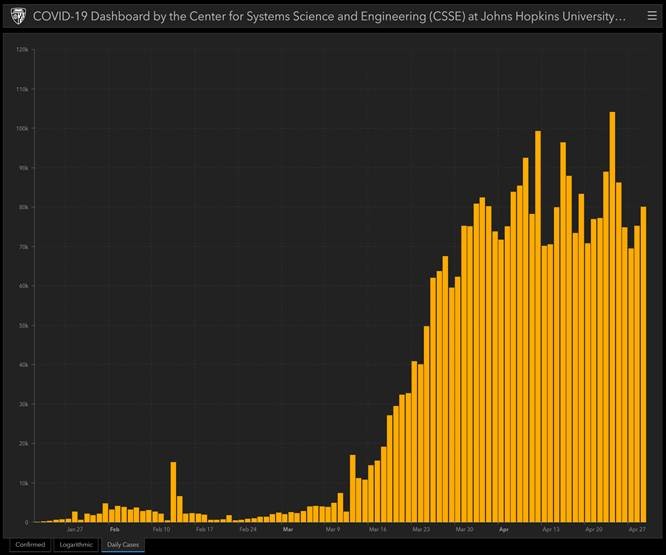
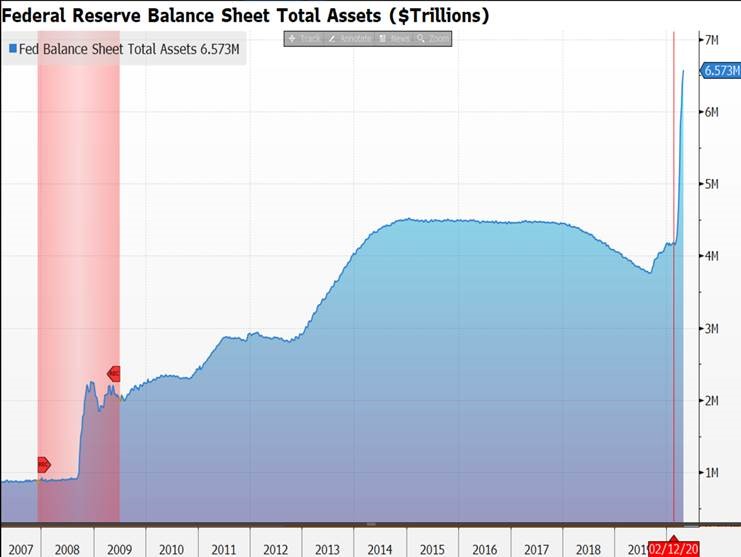
The first chart is daily new cases of the COVID-19 virus here in the U.S. While the date range is hard to see, the market took off when daily new cases started to flatten—maybe even a week beforehand. The second chart is the Fed balance sheet. The Fed is pumping more money, more quickly, into financial markets than they did in the Global Financial Crisis (see the red shaded area). Since late 2019 they’ve expanded the balance sheet by some $2.5 trillion. This served to calm fears that some of the short- and longer-term debt markets may stop functioning. As the saying goes: “Don’t Fight the Fed.”
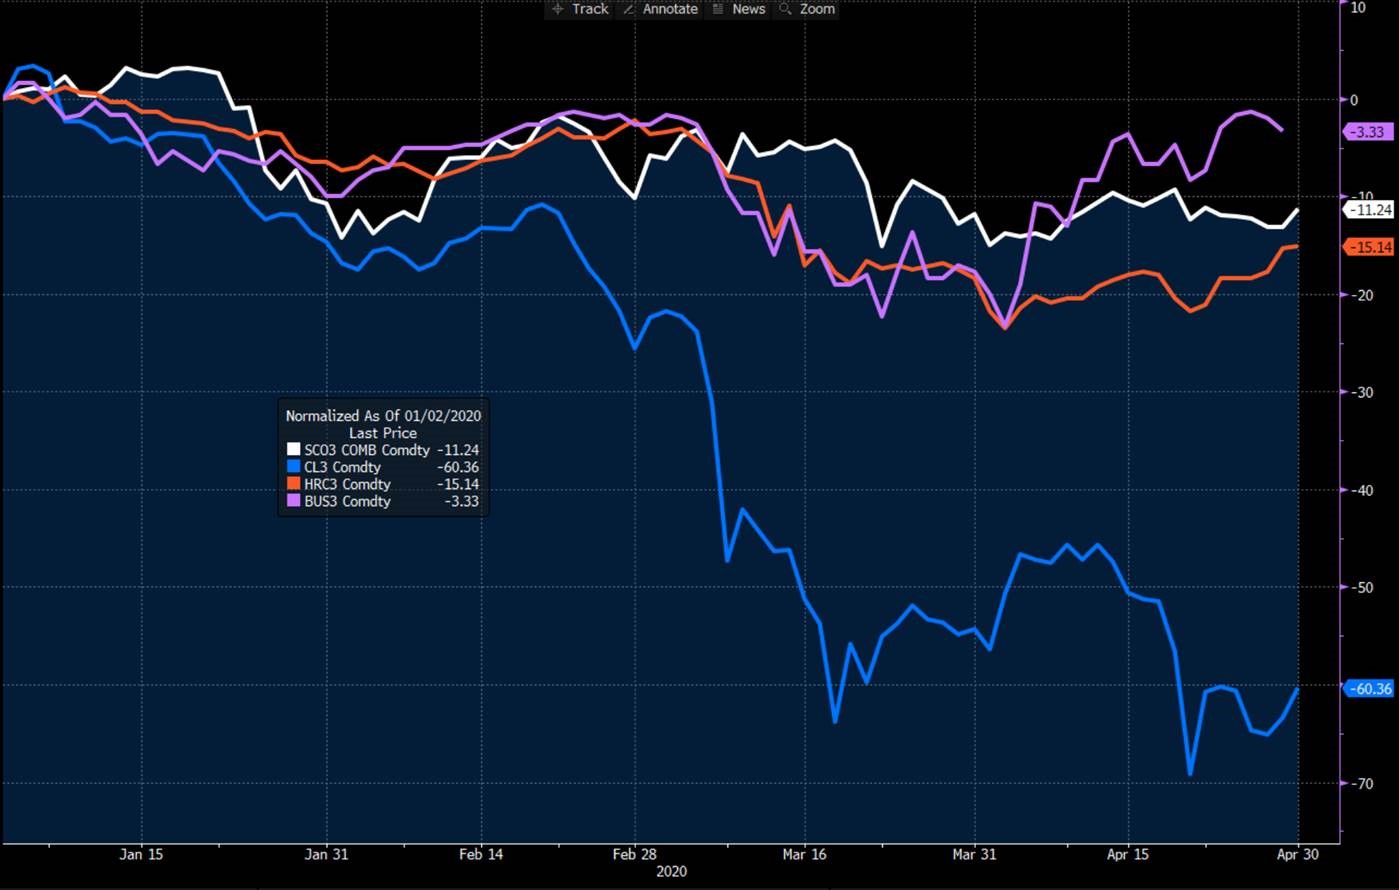
Now on to some of the futures markets. We’ve discussed before the resilience of iron ore in this crisis, but how about scrap? You can see in the below chart the percentage change since Jan. 1, 2020, of oil (blue), HRC (orange), ore (white), and busheling (purple). I’ve used the 3-month forward contract in each commodity for comparison and thus avoided the negative oil price in the spot month. Two observations come to mind. First, the gap between oil and the ferrous complex is enormous. Is this sustainable? Second, what is behind the resiliency in the ferrous complex? I know that may seem like an odd thing to say in a week that saw some of the HRC indices move down dramatically, but that’s why the 3-month contract is helpful as it takes out some of the short term variation. We’d suspect that at least some of the divergence is purely due to the drivers of the different markets. Steel = China. Oil = OPEC.
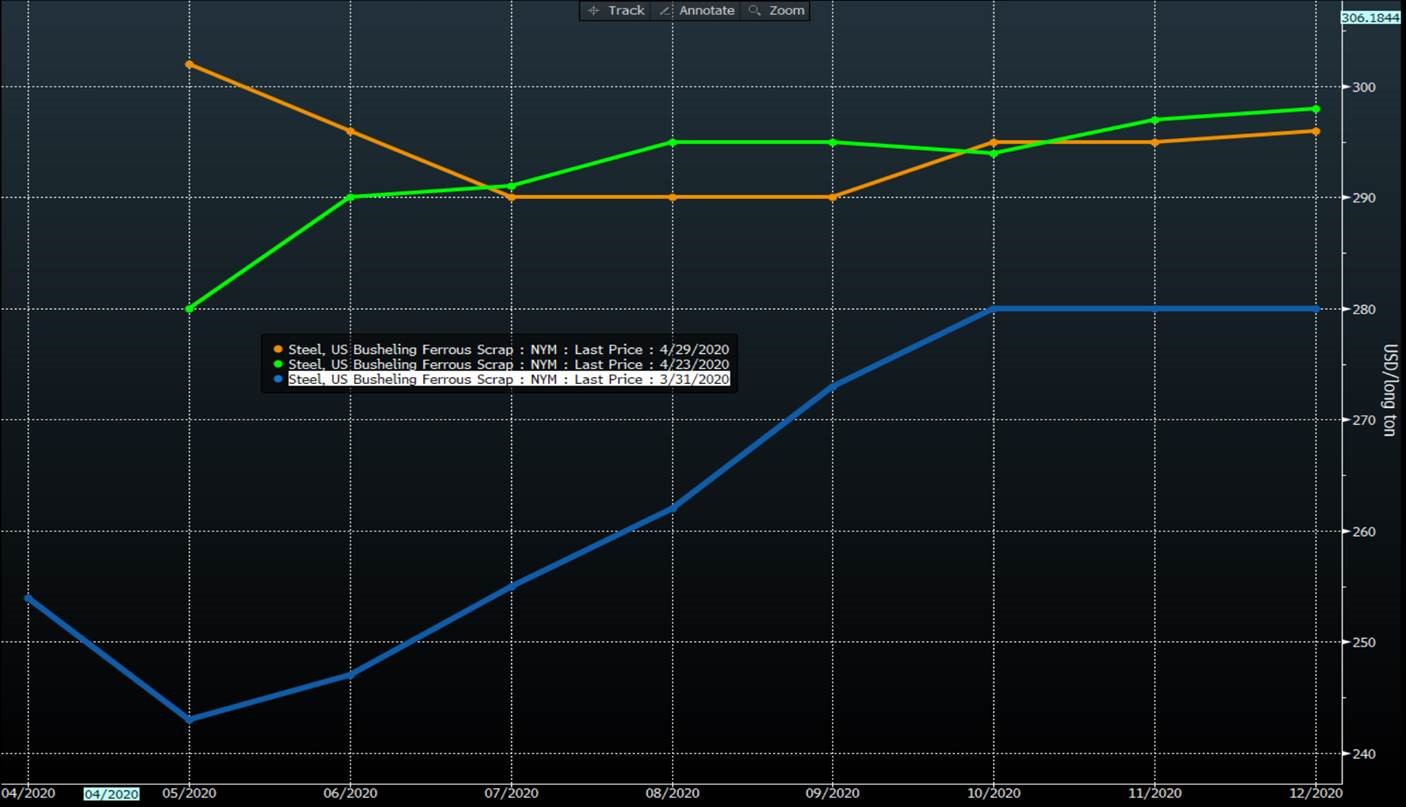
Focusing in a bit on scrap, you can see in the chart below that someone forgot to tell the busheling curve that the world is falling apart. The blue line is from a month ago! It would appear that a big part of the busheling strength is purely supply driven. The automotive shutdowns have had a major negative impact on supply—thus the market has firmed.
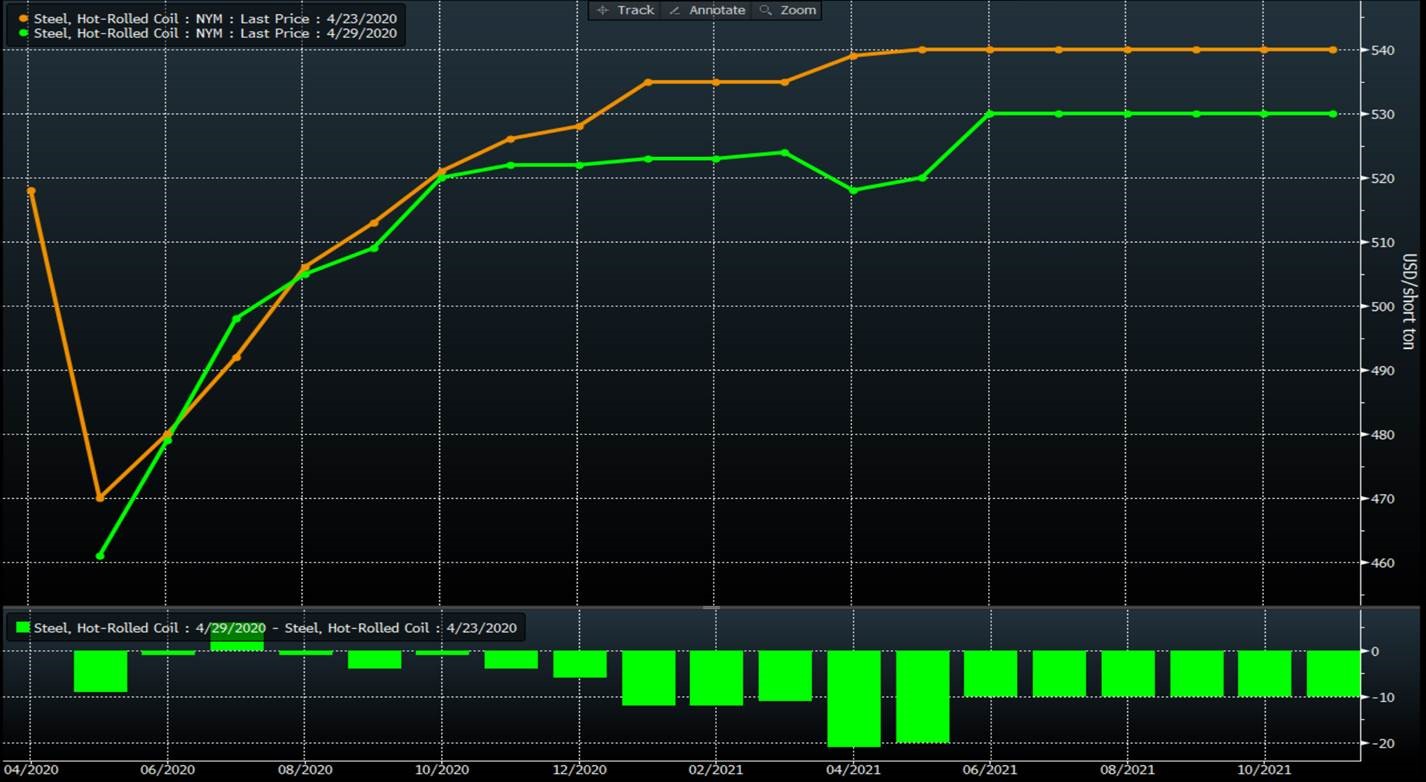
While busheling has been pushed up in the nearby months over the past week, the HRC curve (below) hasn’t changed much until the 2021 time period, where it moved lower over the past week. We’ve seen OEMs who are interested in fixing prices at pretty low numbers relative to history show some interest in buying in that time period, where the sellers may be looking at the spread between nearby months and the future months (the “contango”) and believing it is simply too large to be sustained. These market players would normally buy the nearby months and then sell the “deferreds” or months farther out on the curve.
While March was a record month for volumes on the CME HRC contract, we believe April volumes will be lower. The Busheling contract seems to be gaining some attention as some very large trades went through this past week, and even the screen-based electronic market is seeing more activity. With that we will close and hope that everyone is staying healthy and safe!
Disclaimer: The information in this write-up does not constitute “investment service,” “investment advice” or “financial product advice” as defined by laws and/or regulations in any jurisdiction. Neither does it constitute nor should be considered as any form of financial opinion or recommendation. The views expressed in the above article by Metal Edge Partners are subject to change based on market and other conditions. The information given above must be independently verified and Metal Edge Partners does not assume responsibility for the accuracy of the information

