Market Data

September 3, 2020
Steel Mill Lead Times: Extend by a Week
Written by Tim Triplett
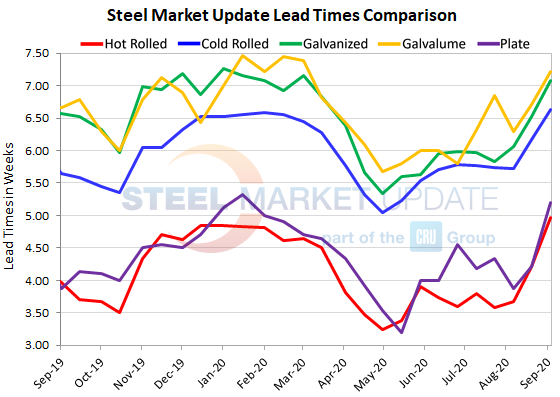
Lead times for spot orders of flat rolled and plate steels have extended by about a week over the past month as demand continues to recover and buying picks up ahead of rising prices. Lead times for hot rolled now average nearly five weeks and coated products more than seven weeks. Lead times are an indicator of steel demand—longer lead times indicate the mills have more orders to process and less likely to negotiate on prices.
According to Steel Market Update’s check of the market this week, hot rolled lead times now average 4.97 weeks, up from 4.21 weeks in late August. HR lead times are 1.72 weeks longer than in the depths of the pandemic in late April at 3.25 weeks.
Cold rolled lead times have extended to 6.64 weeks from 6.17 weeks in SMU’s last check of the market. CR lead times are a week and a half longer than in April when they dipped to 5.04 weeks.
Galvanized lead times have extended to 7.08 weeks, up from 6.53 in late August and a week longer than a month ago. The current average Galvalume lead time is 6.71 weeks.
Plate lead times bottomed at 3.20 weeks in mid-May. The latest reading, at 5.20 weeks, is up two weeks from the trough and one week from the 4.22 registered two weeks ago.
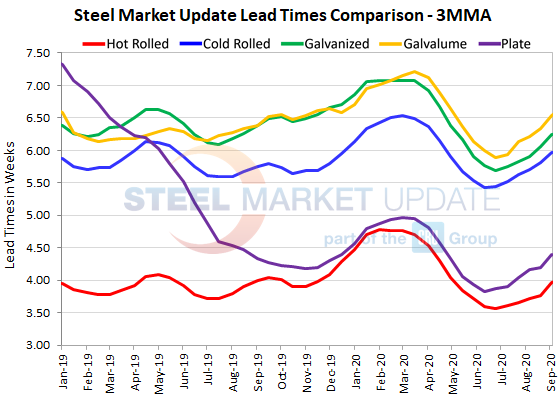
Looking at three-month moving averages, which smooth out the variability in the biweekly readings, lead times for flat rolled and plate have continued inching upward since late June. The current 3MMA for hot rolled is 3.97 weeks, cold rolled is 5.97 weeks, galvanized is 6.24 weeks, Galvalume is 6.53 weeks and plate is 4.39 weeks.
Note: These lead times are based on the average from manufacturers and steel service centers who participated in this week’s SMU market trends analysis. Our lead times do not predict what any individual may get from any specific mill supplier. Look to your mill rep for actual lead times. Our lead times are meant only to identify trends and changes in the marketplace. To see an interactive history of our Steel Mill Lead Times data, visit our website here.