Market Data

September 16, 2020
Update on Manufacturing Indicators Through August
Written by Brett Linton
U.S. manufacturing indicators continued to show signs of improvement in July and August data as the economy recovers from the coronavirus shutdowns. The health of the manufacturing economy has a direct bearing on the health of the steel industry.
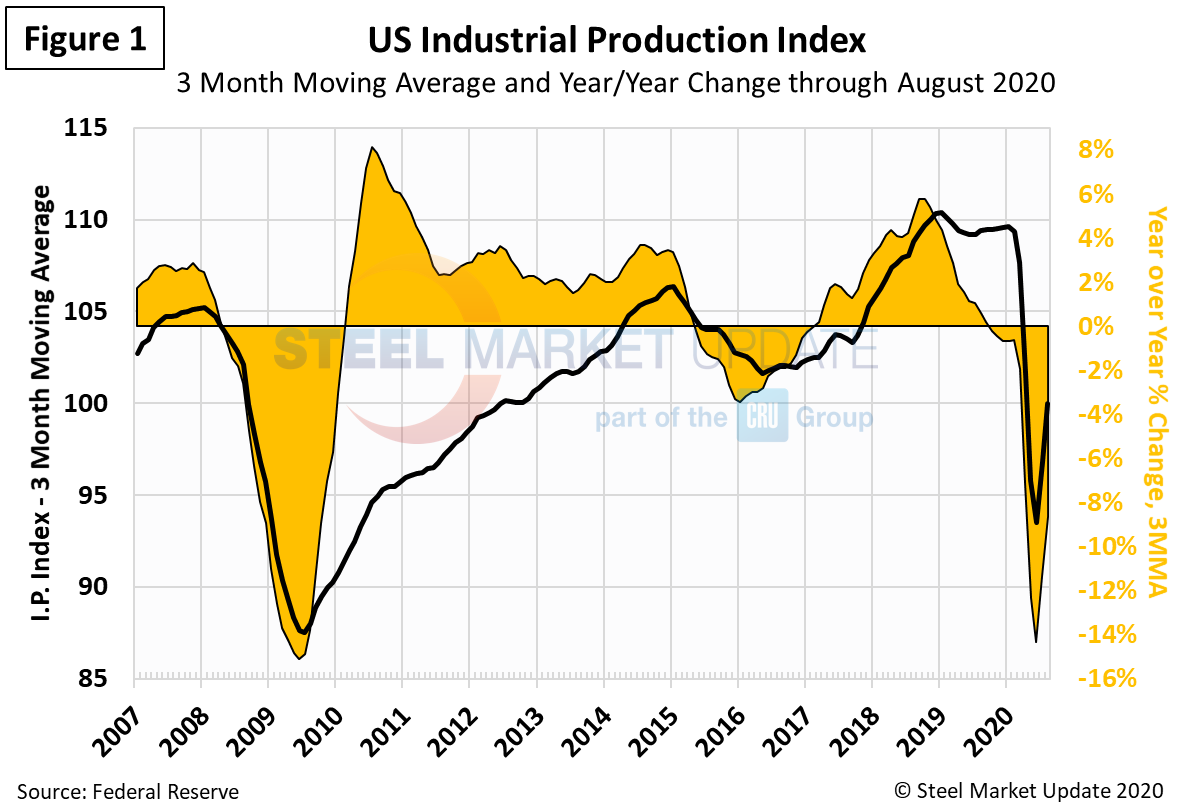
![]() The Industrial Production Index
The Industrial Production Index
The Industrial Production (IP) index is a gauge of output from factories, mines and utilities. Industrial production took a serious hit from the shutdowns of nonessential businesses and other measures mandated by the government in the first and second quarters to stem the spread of the coronavirus. Figure 1 shows the 3MMA of the IP index since January 2007 as the black line and the year-over-year change as the brown shading. Since the June 2020 low, the 3MMA of the IP index has increased by 7 percent, from 93.49 to 99.97. This remains low in comparison to the January 2019 high of 110.39, which was also the record high in our 27+ year data history.
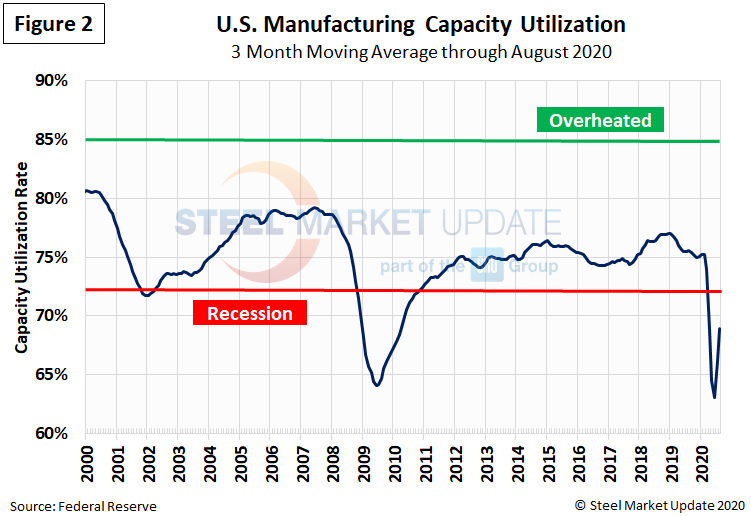
Manufacturing Capacity Utilization
Manufacturing capacity utilization, measured as a 3MMA, has been in recessionary territory since April 2020. The latest data point for August is 69 percent, up from May’s 63 percent low, but down from the 76 percent level seen one year ago (Figure 2).
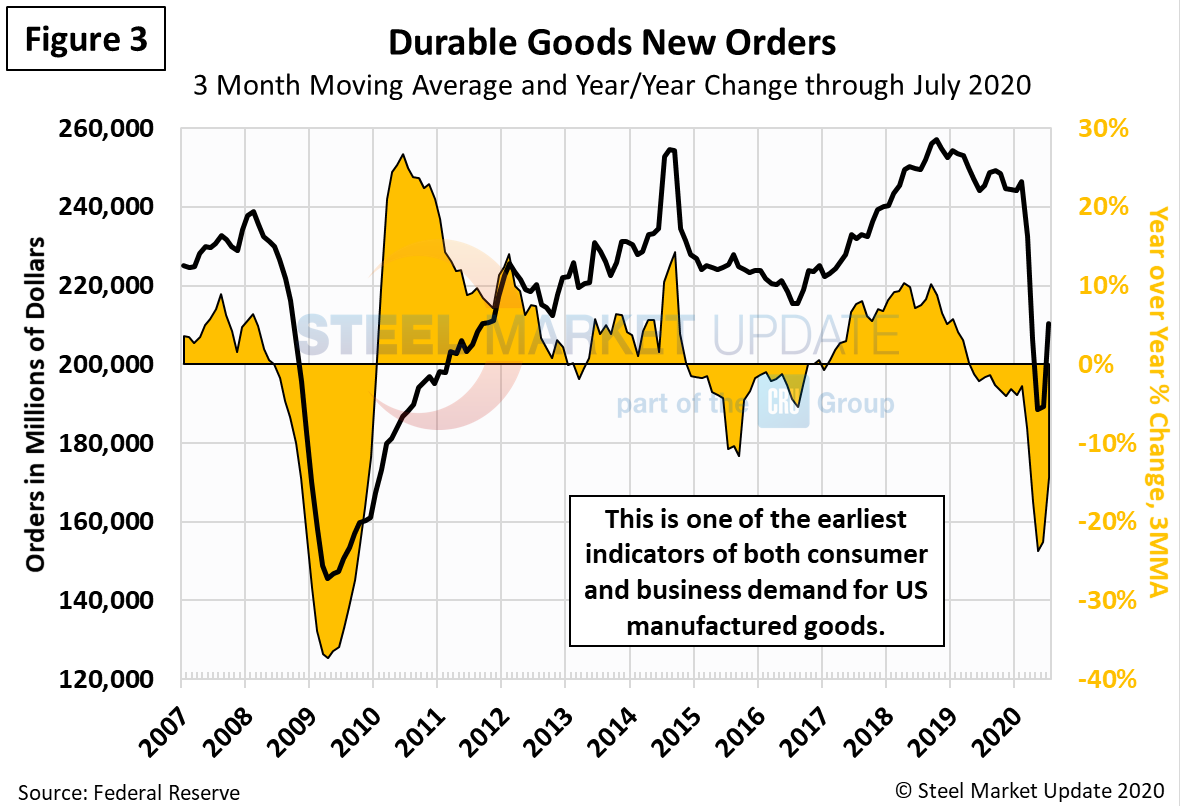
New Orders for Durable Goods
New orders for durable goods, an early indicator of consumer and business demand for U.S. manufactured goods, suffered a similar shock from the virus in March but has began to recover (Figure 3). The 3MMA dropped by more than 23 percent from February through May, from a peak of $246.4 billion to a low of $188.4 billion. Durable goods orders rose 11.1 percent from June to July to $210.2 billion, which is positive news for the economy.
New Orders for Manufactured Products
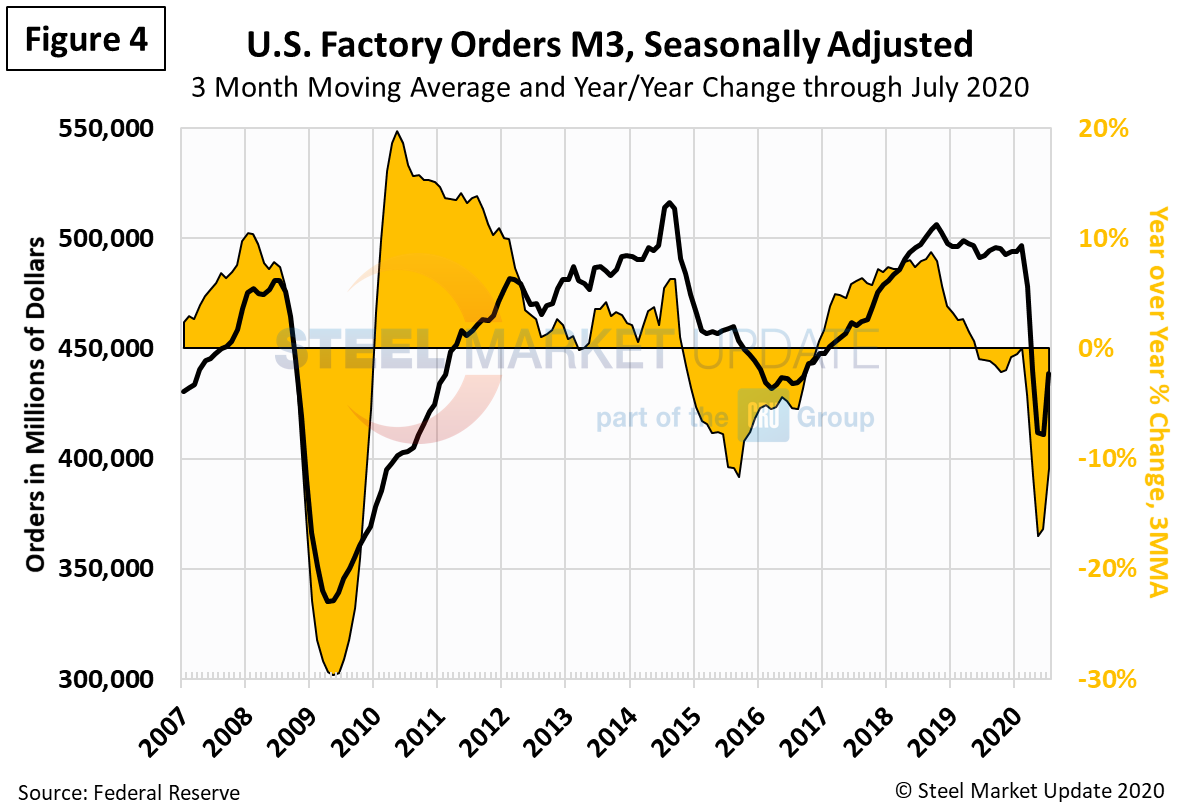
The year-over-year growth rate of new orders for manufactured products as reported by the Census Bureau was slightly negative for most of 2019, then declined sharply in March 2020 (Figure 4). On a 3MMA basis, factory orders declined to $410.7 billion in June (nearly a 10-year low) but bounced back in July to $438.7 billion.
New Orders for Products Manufactured from Iron and Steel
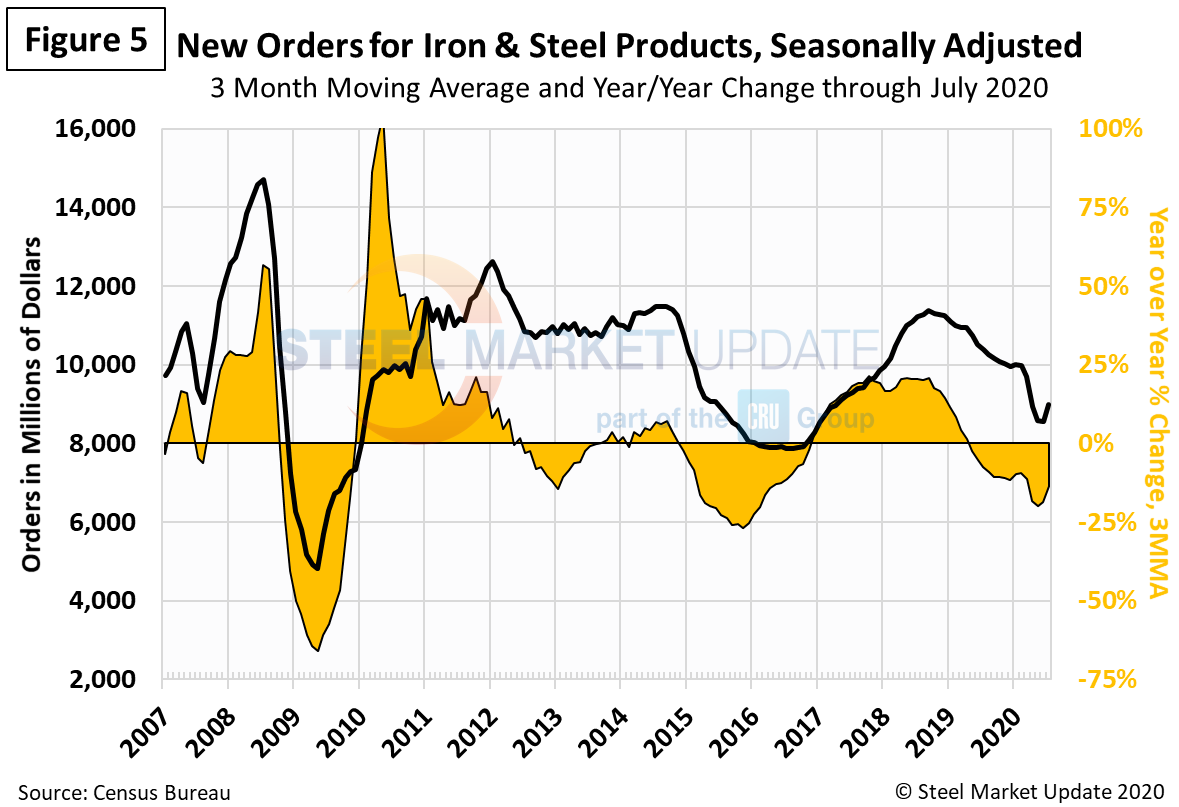
Within the Census Bureau M3 manufacturing survey is a subsection for iron and steel products. Figure 5 shows the history of new orders for iron and steel products since January 2000 as a 3MMA. This year-over-year growth rate has also been negative since mid-2019, hitting a low of negtive 20 percent in May and currently at negative 14 percent in July.
Inventories of Products Manufactured from Iron and Steel
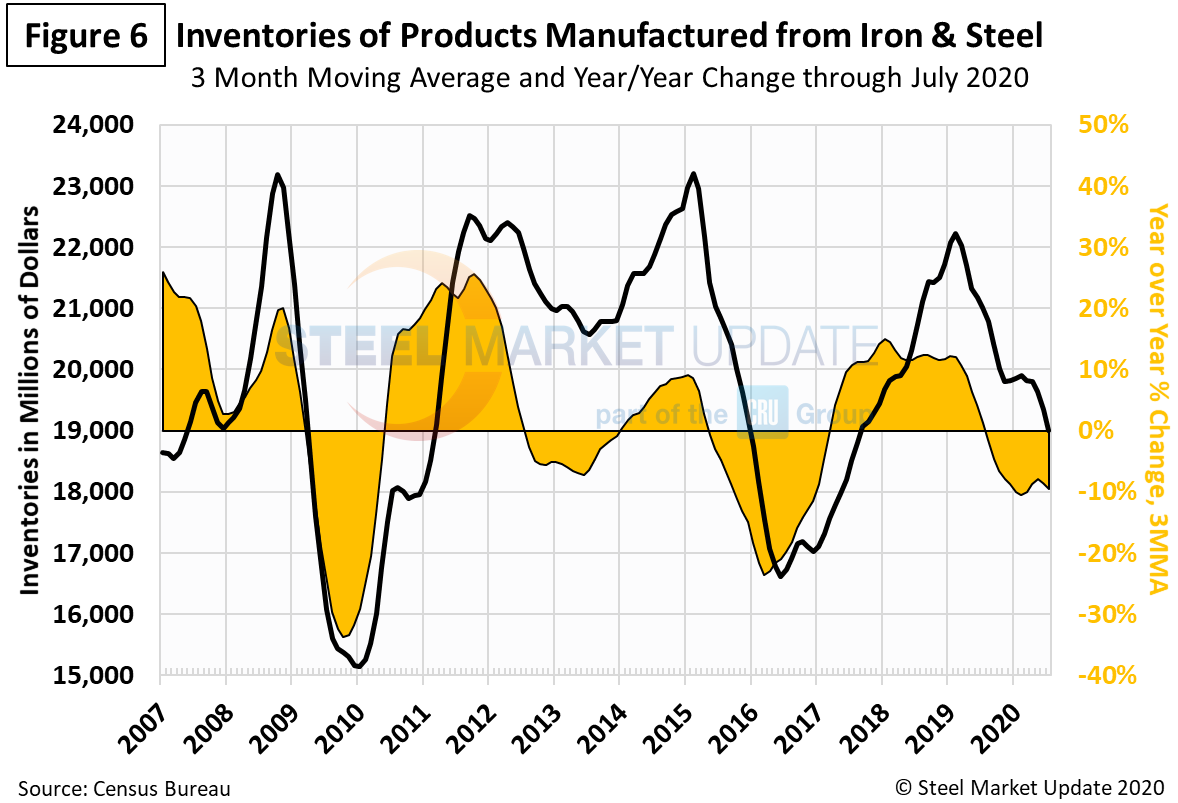
Inventories of iron and steel products continued to decline since our last update, down 9.5 percent year-over-year to $19.008 billion in July, the lowest level since August 2017 (Figure 6).
The ISM Manufacturing Index
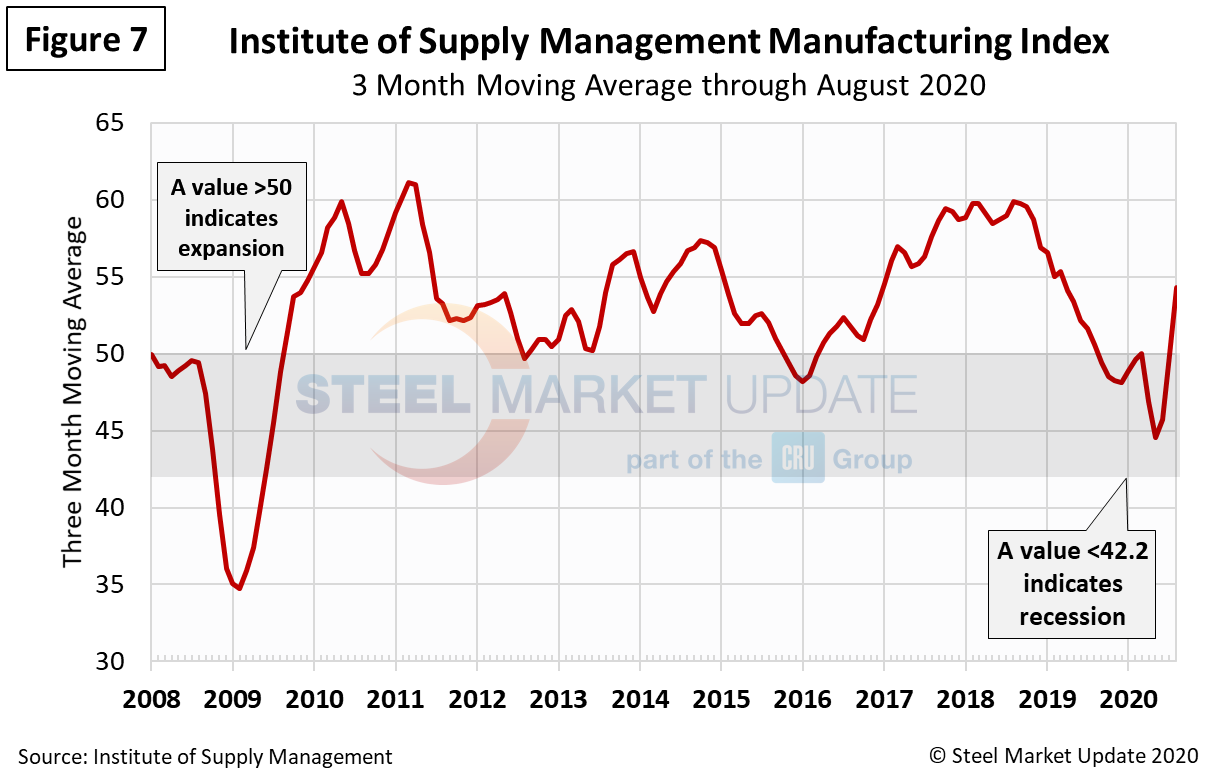
The Institute for Supply Management’s Manufacturing Index is a diffusion index; a value above 50 indicates that the manufacturing economy is expanding, while a value below 42.2 indicates a recession. As Figure 7 shows, the index measured as a 3MMA had declined well into contraction territory in April, May and June. The latest data for July and August indicate the manufacturing economy is no longer contracting and is now expanding.
“The August PMI registered 56 percent (not a 3MMA), up 1.8 percentage points from the July reading of 54.2 percent. This figure indicates expansion in the overall economy for the fourth month in a row after a contraction in April, which ended a period of 131 consecutive months of growth,” said Timothy Fiore, chairman of ISM’s Manufacturing Business Survey Committee. “After the coronavirus (COVID-19) brought manufacturing activity to historic lows, the sector continued its recovery in August, the first full month of operations after supply chains restarted and adjustments were made for employees to return to work.”