

Product

September 24, 2020
Hot Rolled Futures: October Pushes to New Highs Shifting Curve into Backwardation
Written by David Feldstein
Editor’s note: SMU Contributor David Feldstein is president of Rock Trading Advisors. David has over 20 years of financial market trading experience and has been active in the ferrous futures space for eight years. David earned an MBA from the University of Chicago Booth School of Business with concentrations in economics, statistics and analytical finance.
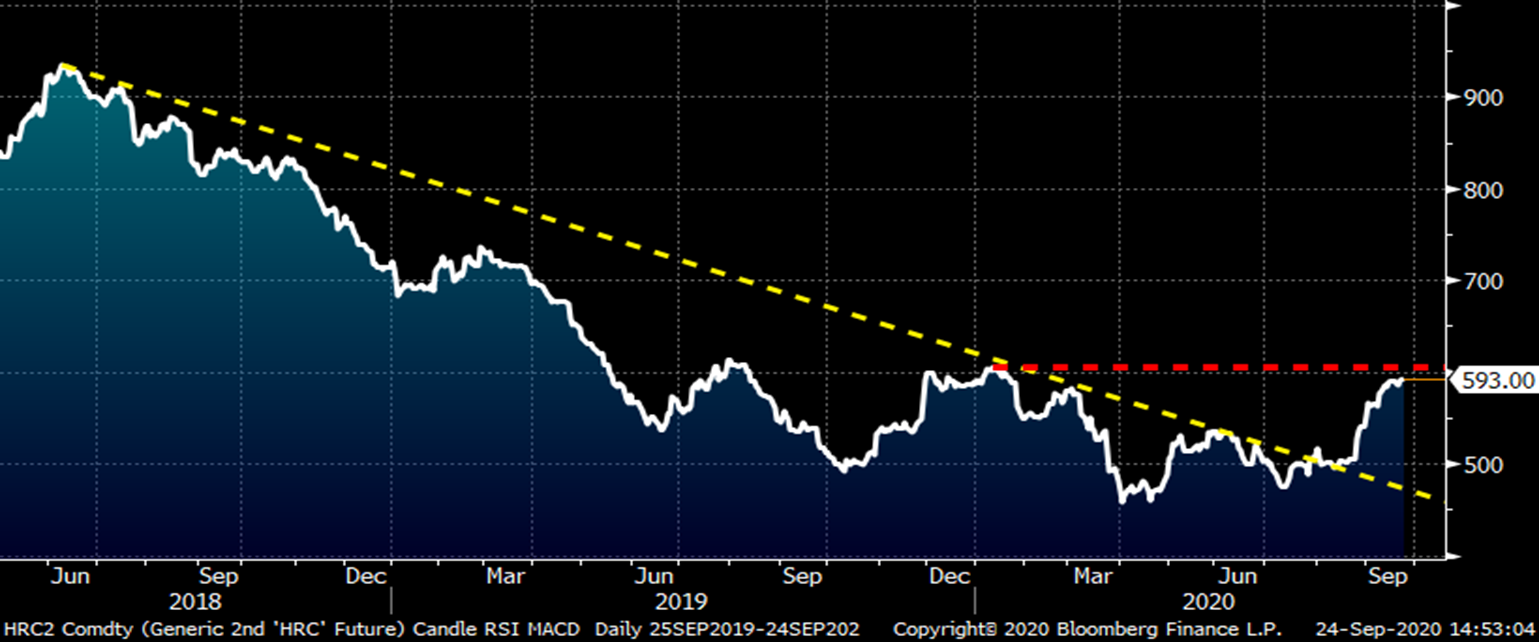
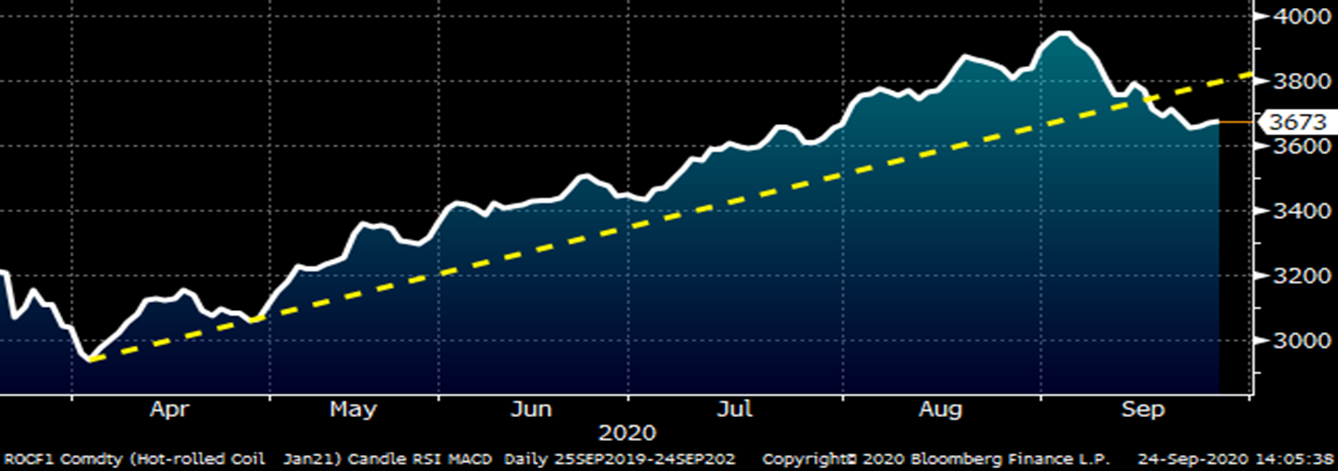
The September CME Midwest HRC future is set to settle the month somewhere between $544 and $550 depending on next Wednesday’s CRU Index. That will be an increase of $93-$99/st over August’s CME HR future settlement of $451. What a five-weeks it has been! We haven’t seen a comeback this amazing since Super Bowl LI. “Availability” has become the buzzword of September as suddenly there is no steel. The rolling 2nd month future has broken above its multi-year down trend with authority gaining $30 since my last article on September 3. The red line is the next resistance level just above $600.
Rolling 2nd Month CME Hot Rolled Coil Future $/st
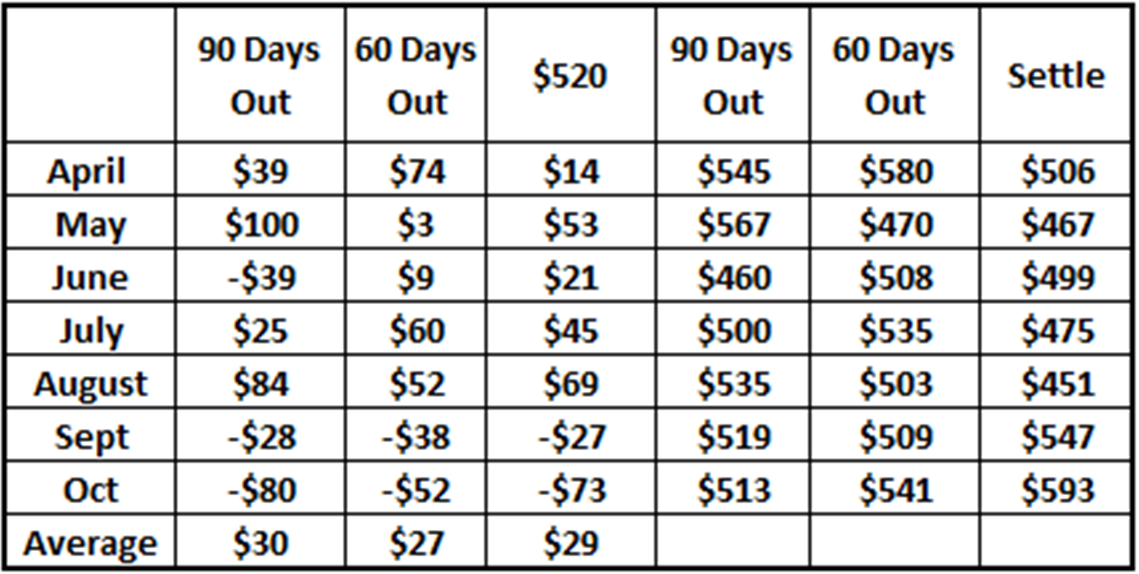
Hedging downside price risk in CME HRC futures has been a winning stategy (for downside risk) during the pandemic. I have been providing an update for the last few articles looking at implementing a strategy of selling at $520, 90 days or 60 days prior to settlement. Assuming September settles at $547, hedging would have provided about $30 profit per ton per month regardless of the strategy from April through September. However, October’s sharp move higher is looking to take back some of those hedging gains, but then again that’s the point. Service centers and mills that had implemented a hedging strategy throughout 2020 would have benefited greatly from these profits and cashflows. It is a strategy and not a magic bullet. Although some of those profits earned in previous months have been lost, the physical side of the business is full steam ahead as profit margins are expanding and these firms are seeing a much busier and happier sales/work force.
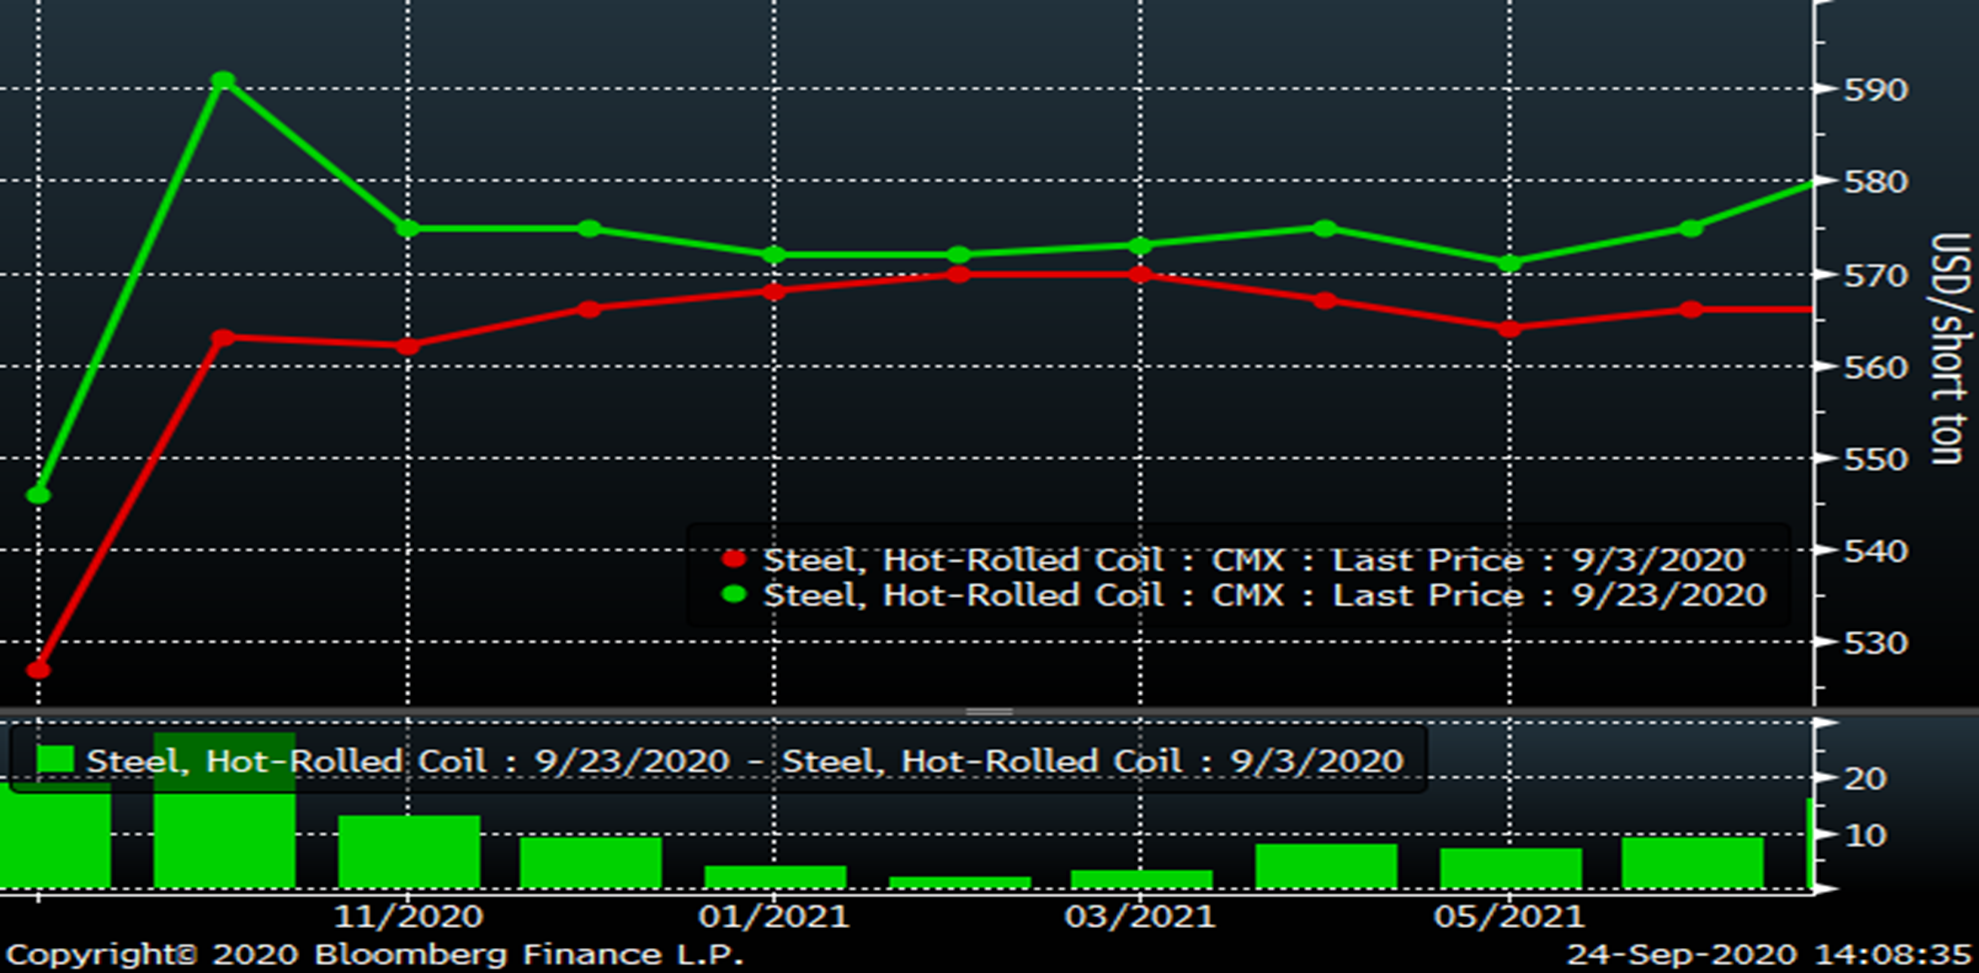
Aggressive buying of futures had been occurring throughout September until the end of last week when the buying slowed. At the end of last week, a cluster of Q4 futures sellers were gathered up at $595, but as they say in trading, “nothing done.” November and December had trade $590 many times, but this week, those buyers backed off and sellers stepped in with November and December closing last night at $575. There has been buying interest in the October future and that interest picked up further after yesterday’s CRU print. The buying interest in October has shifted the curve from contango (upward sloping) to flat to backwardated (downward sloping) in a matter of a few weeks. At this point, the futures market is indicating a no confidence vote that this rally will continue much longer.
CME Midwest HRC Futures Curve $/st
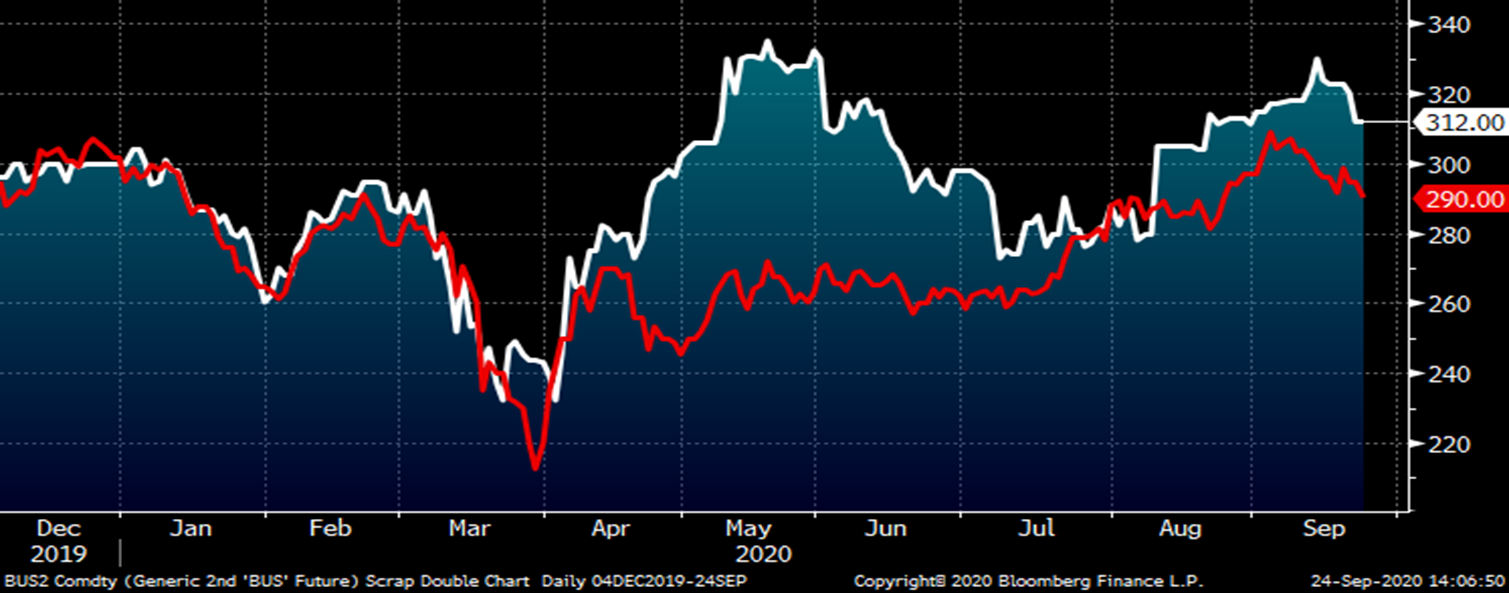
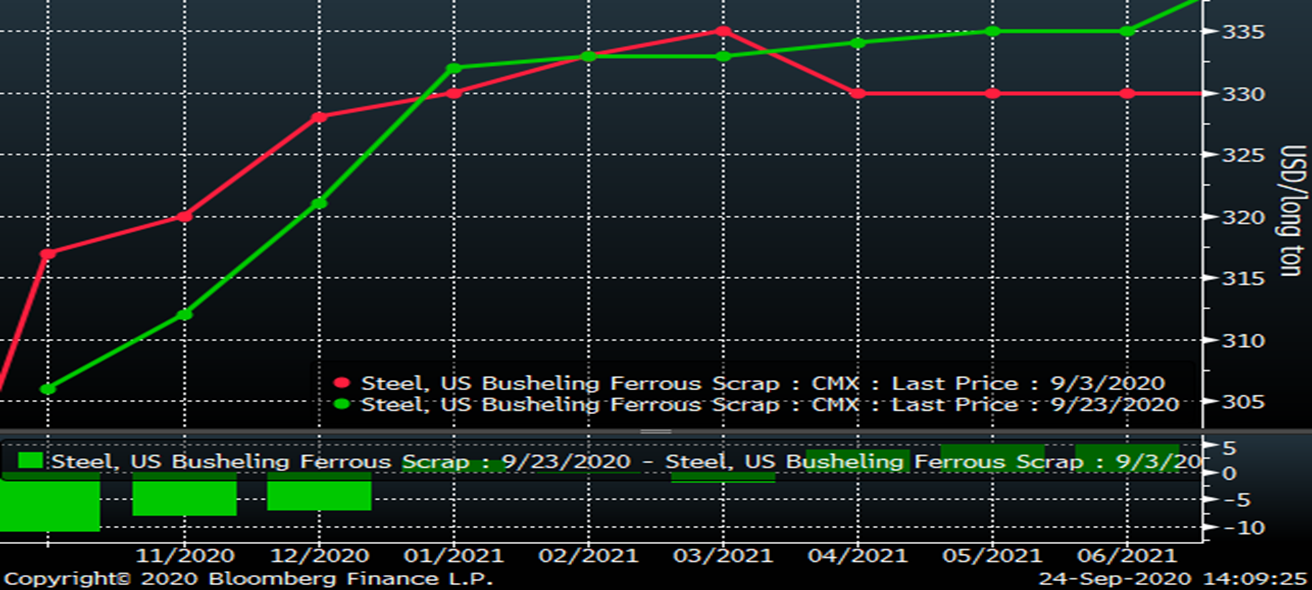
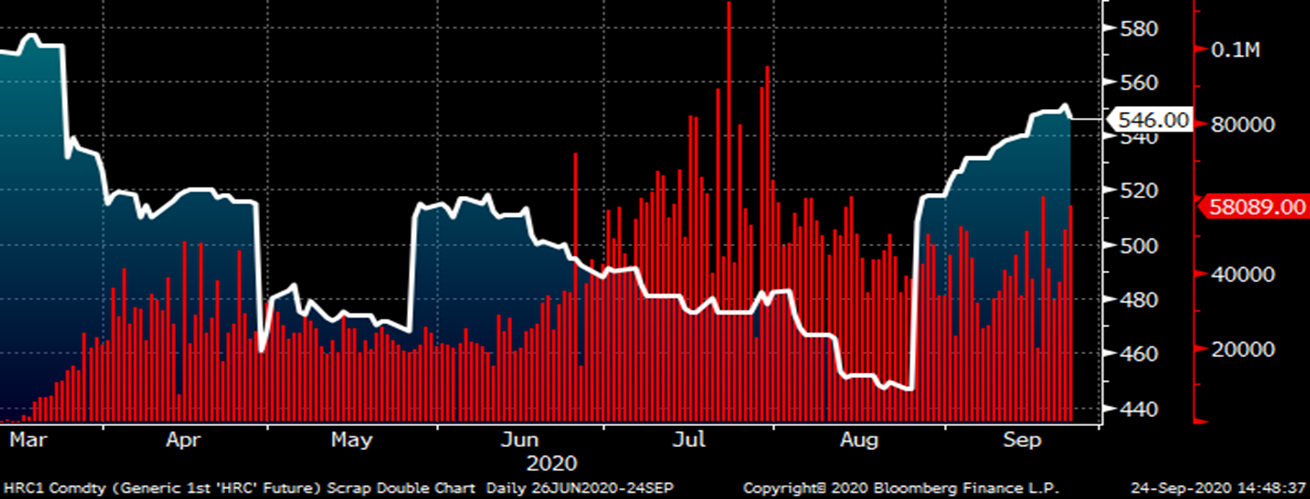
This is understandable as domestic flat rolled prices have a number of major hurdles to contend with. Scrap prices have sold off over the last two weeks. October busheling was initially trading up $30 at $318, but has since fallen back settling last night at $306 while Turkish scrap continues to move lower settling today at $290/t.
Rolling 2nd Month CME Busheling Future $lt (white) & LME Turkish Scrap Future $/mt (red)
Below is the CME Busheling futures curve with the front three months i.e. Q4 falling $6-$11 since September 3.
CME Busheling Futures Curve $/lt
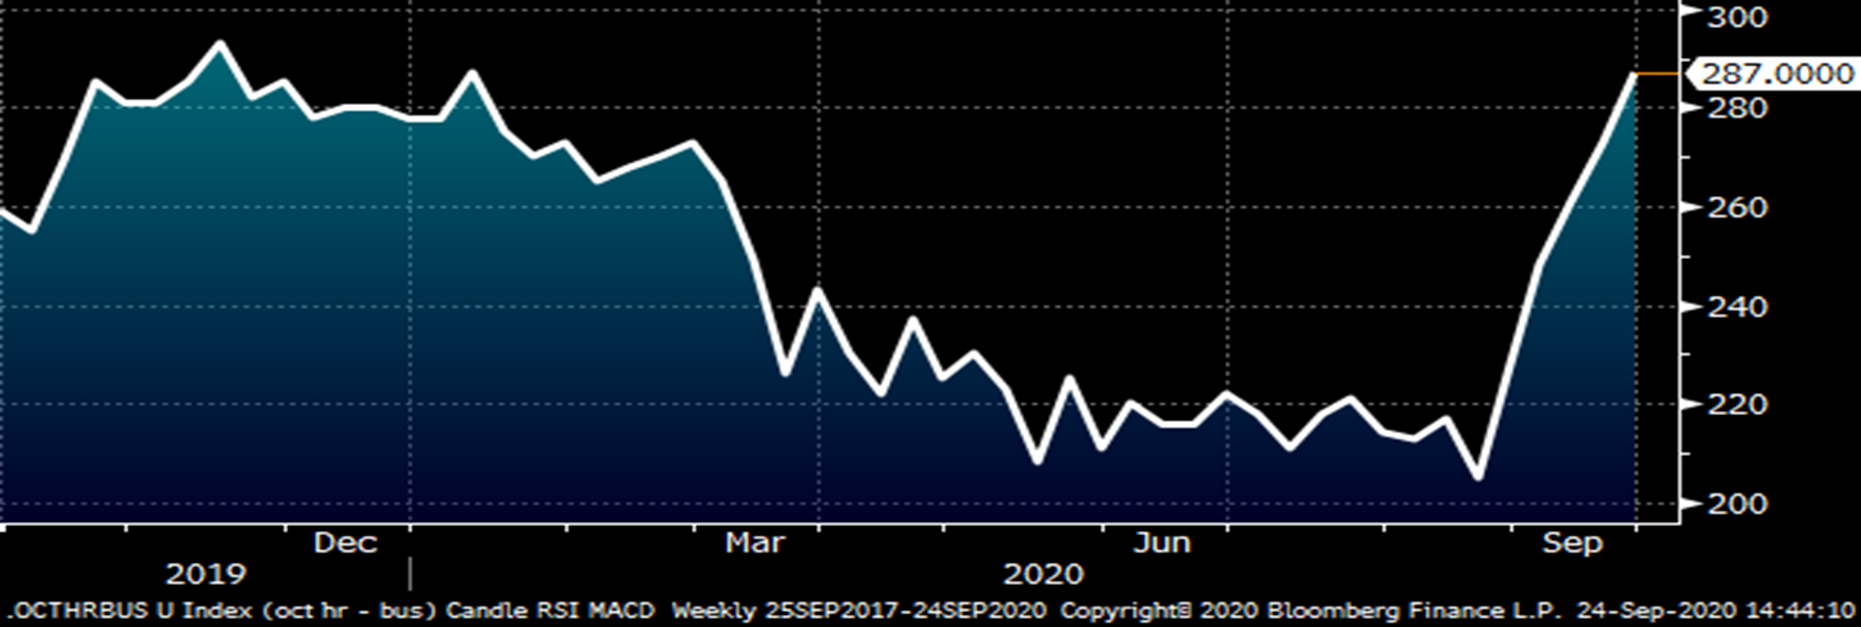
With October HR rallying and October Busheling falling, the “”metal spread” has expanded sharply to $287, its best level since January.
October Midwest HRC Minus Busheling Spread
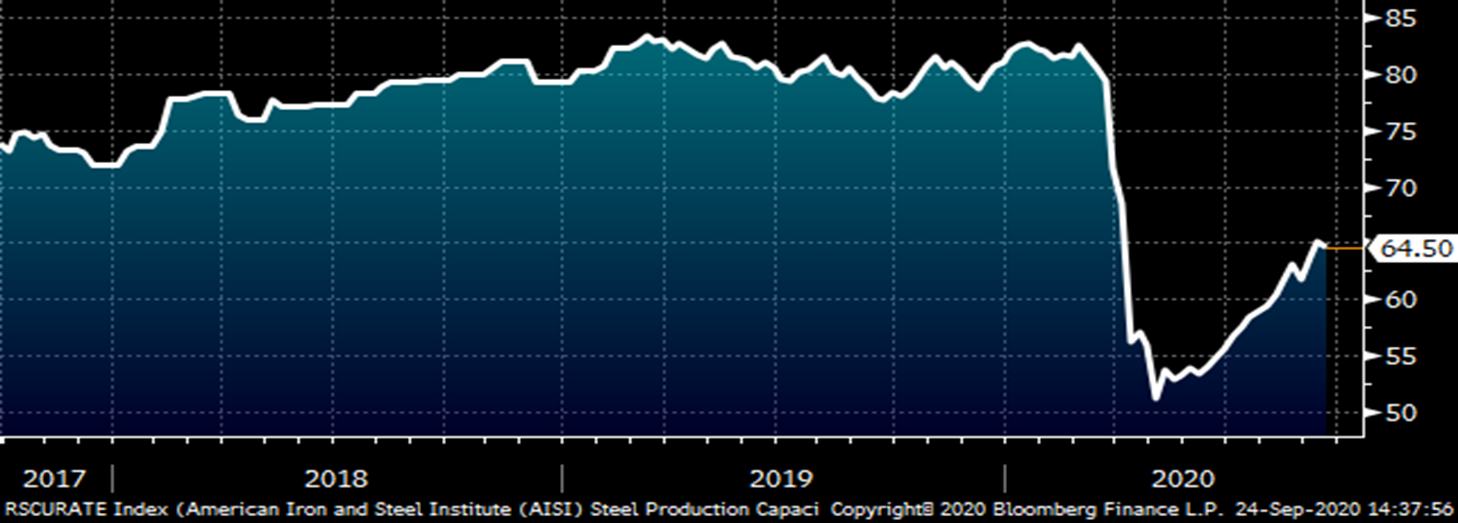
Capacity utilization presents another complication to the rally. At 64.5% utilization, can’t the mills make more steel? It would seem the EAFs would be motivated to capture the $287 spread. Look at this chart. There’s no steel available. Look at the chart again. Confused? Will the other shoe drop and a mill announce they are bringing up yet another mill? This is not necessary as the 10+ million tons of rated capacity already being brought back up has considerable slack, just look at the chart below. Additional tons are coming in the weeks ahead as is Big River 2.
AISI Crude Steel Capacity Utilization

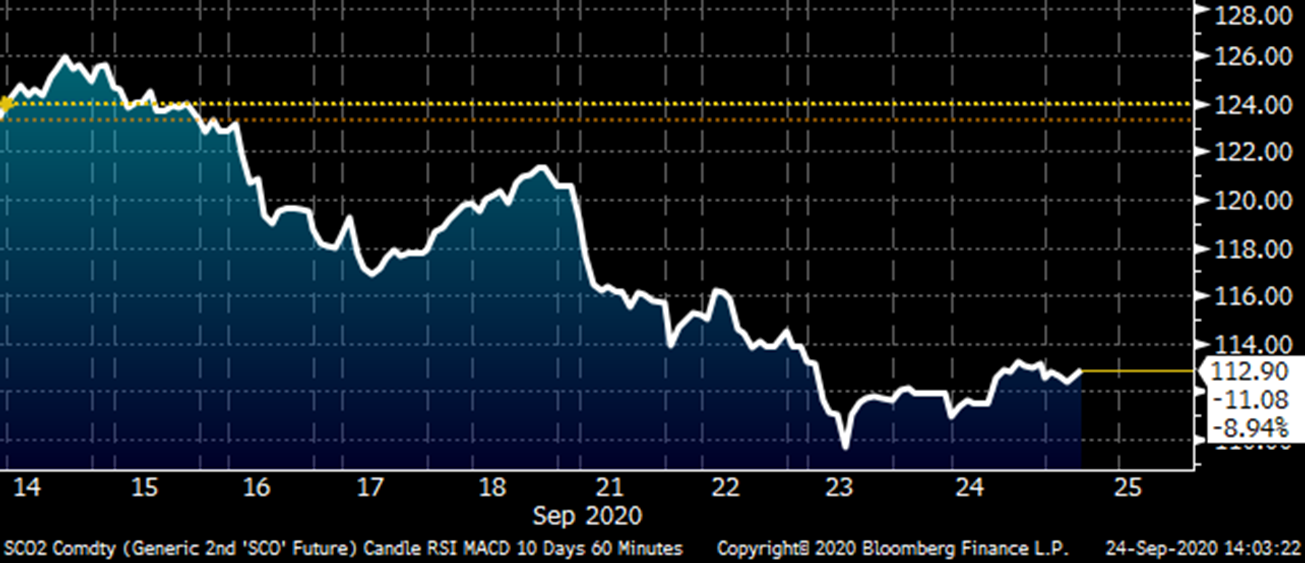
The People’s Bank of China announced stricter capital-reserve requirements and risk management rules on September 13 to take effect on November 1 (right before our election) aimed at large state-owned and private conglomerates that control financial businesses which could pose systemic risks. Since this announcement, futures on iron ore, Chinese steel, aluminum, copper nickel and zinc have all traded lower most breaking below their up trendlines. This chart of the October iron ore future shows the reaction post announcement falling from $126 to as low as $109 on Tuesday.
October SGX Iron Ore Future $/mt
China’s financial system looks to be overleveraged with speculation in equities and commodities. China’s government has started the process of unwinding their dovish policy as evidenced by the stronger yuan, decreased PBOC balance sheet, slowing money supply and decrease in new yuan loans. The one area that saw growth in August was China’s aggregate financing, which is the total of the banking sector, not directly controlled by the government. Until they change policy and increase reserve requirements that is. This will result in deleveraging and the unwinding of these speculative trades. This could result in sharp moves lower. The SHFE active month January HRC future has also fallen and is now down over $40/t since peaking on September 3.
January SHFE HRC Future yuan/mt
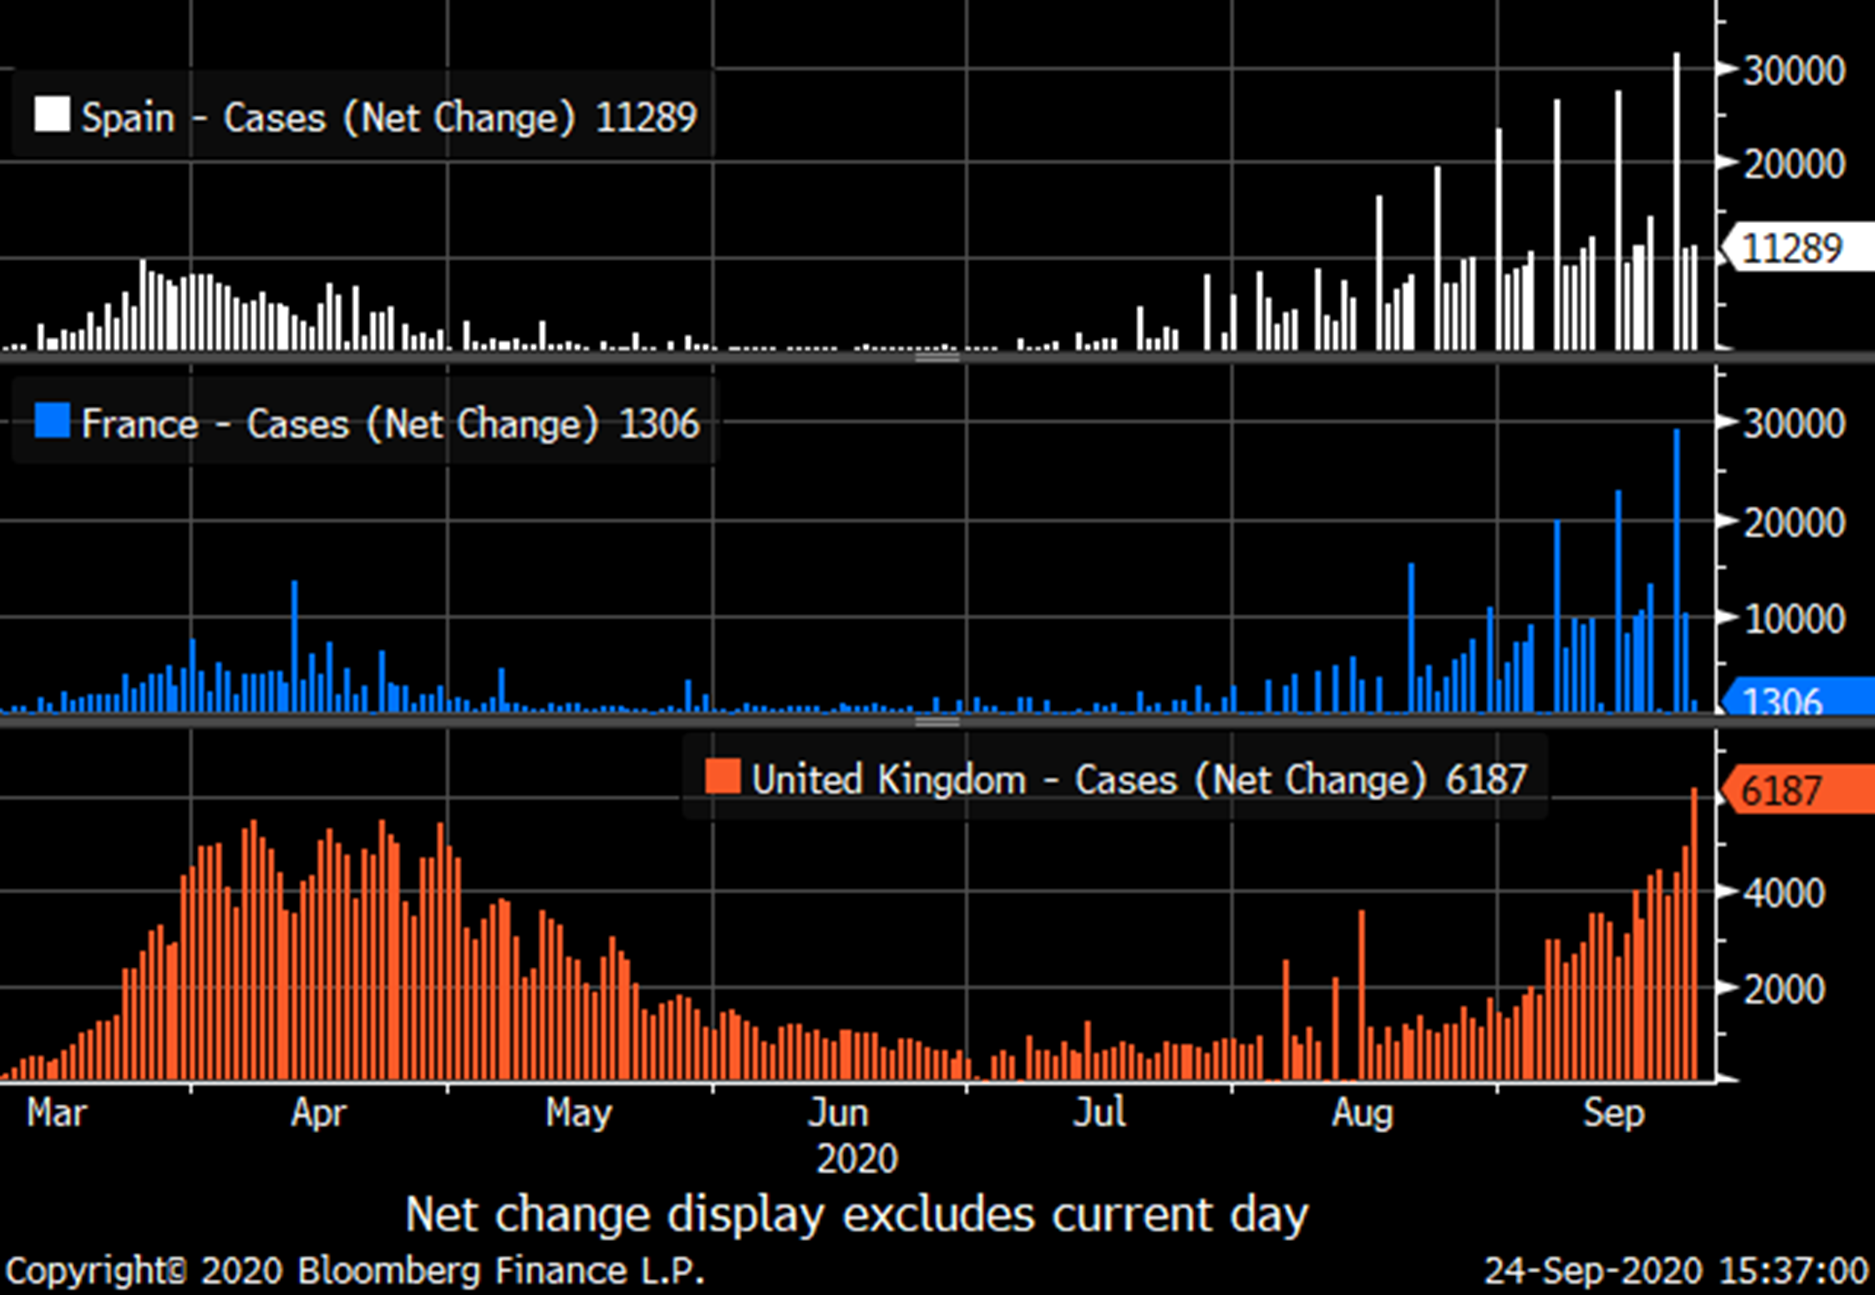
As discussed in the last article, a second outbreak of COVID across Europe has continued to follow the same pattern of exponential growth seen all over the globe. This time, the outbreaks in Spain and France have reached even higher numbers than during the debilitating initial wave. The U.K. is on the cusp of eclipsing their initial outbreak.
New Daily COVID-19 Cases- Spain, France and U.K.
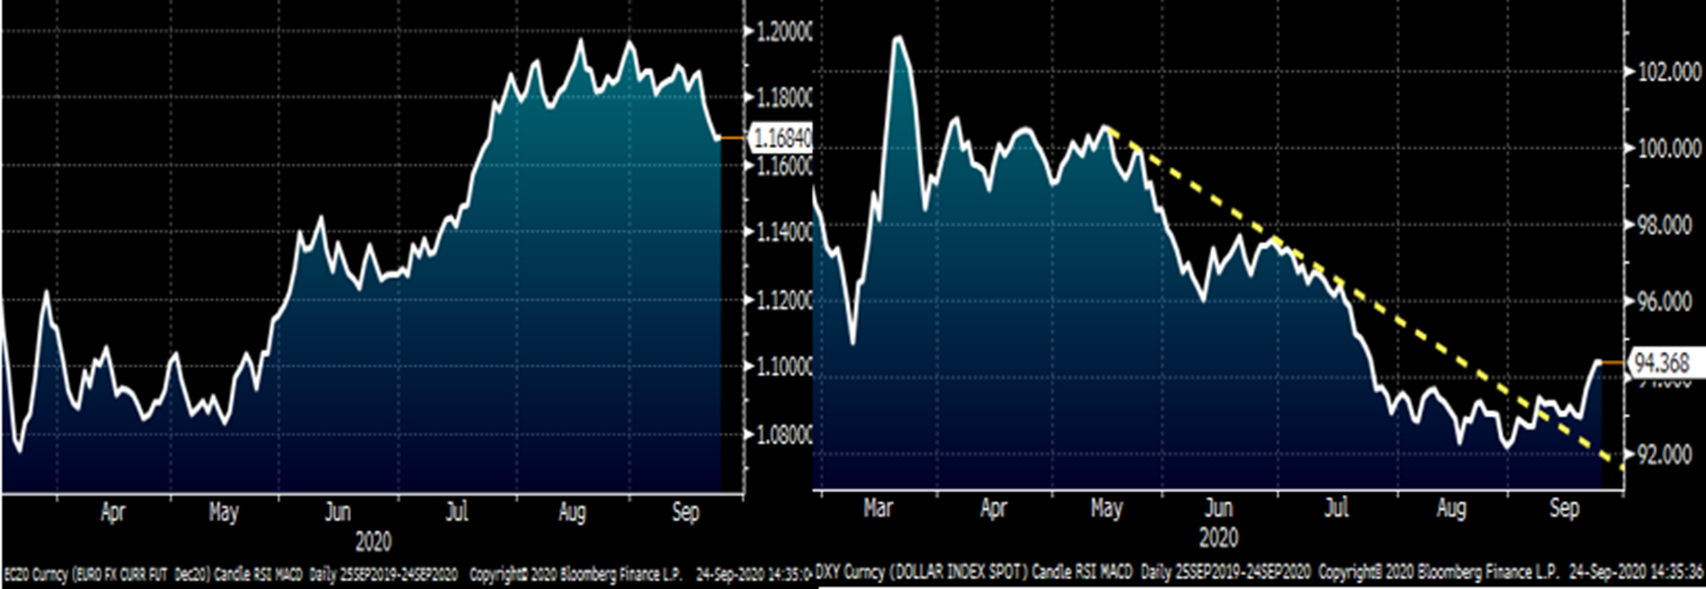
The dollar and euro look to have been driven by their relative COVID outbreaks in recent months with the euro rallying sharply as their initial outbreak came under control and then rallied sharply higher in July as the U.S. outbreak was peaking. As the current outbreak in Europe has gained momentum, the dollar index has broken higher reinforcing this idea that the outbreaks are driving financial flows. A higher dollar weakens commodity prices and vice-a-versa. Moreover, exponential outbreaks cripple economies, notably gasoline and oil demand.
Euro/U.S. Dollar Spot (left) & U.S. Dollar Index (right)
Just as COVID infections look to be driving currency flows, this chart of front month HRC and U.S. daily new COVID cases shows a similar relationship. As new cases took hold in April, hot rolled plummeted. After rebounding in June, the hot rolled price fell dramatically over the summer as the number of new cases in the U.S. exploded.
Front Month CME Hot Rolled Coil Future $/st (white) New Daily COVID-19 Cases- USA (red)
Considering Europe’s success in keeping new COVID cases under control over the summer only to now see an overwhelming resurgence, it seems highly likely the U.S. will also experience another wave. Based on the mathematics and patterns of COVID infections, the next wave will see significantly higher infections than what was seen over the summer. The return from summer vacation, Labor Day weekend, students back in school and the return of football (bars) are a few additional factors to fuel the next wave.
In the graphs below, I highlight Memorial Day with the yellow vertical line followed by the red line on June 25 to signify when the growth in new cases started to materially pick up, then the red line on July 23 at the peak and then finally the red line on August 16 identifying the end of the post Memorial Day wave. Last, I put a yellow line on Labor Day.
New Daily COVID-19 Cases- USA, CA, FL, TX
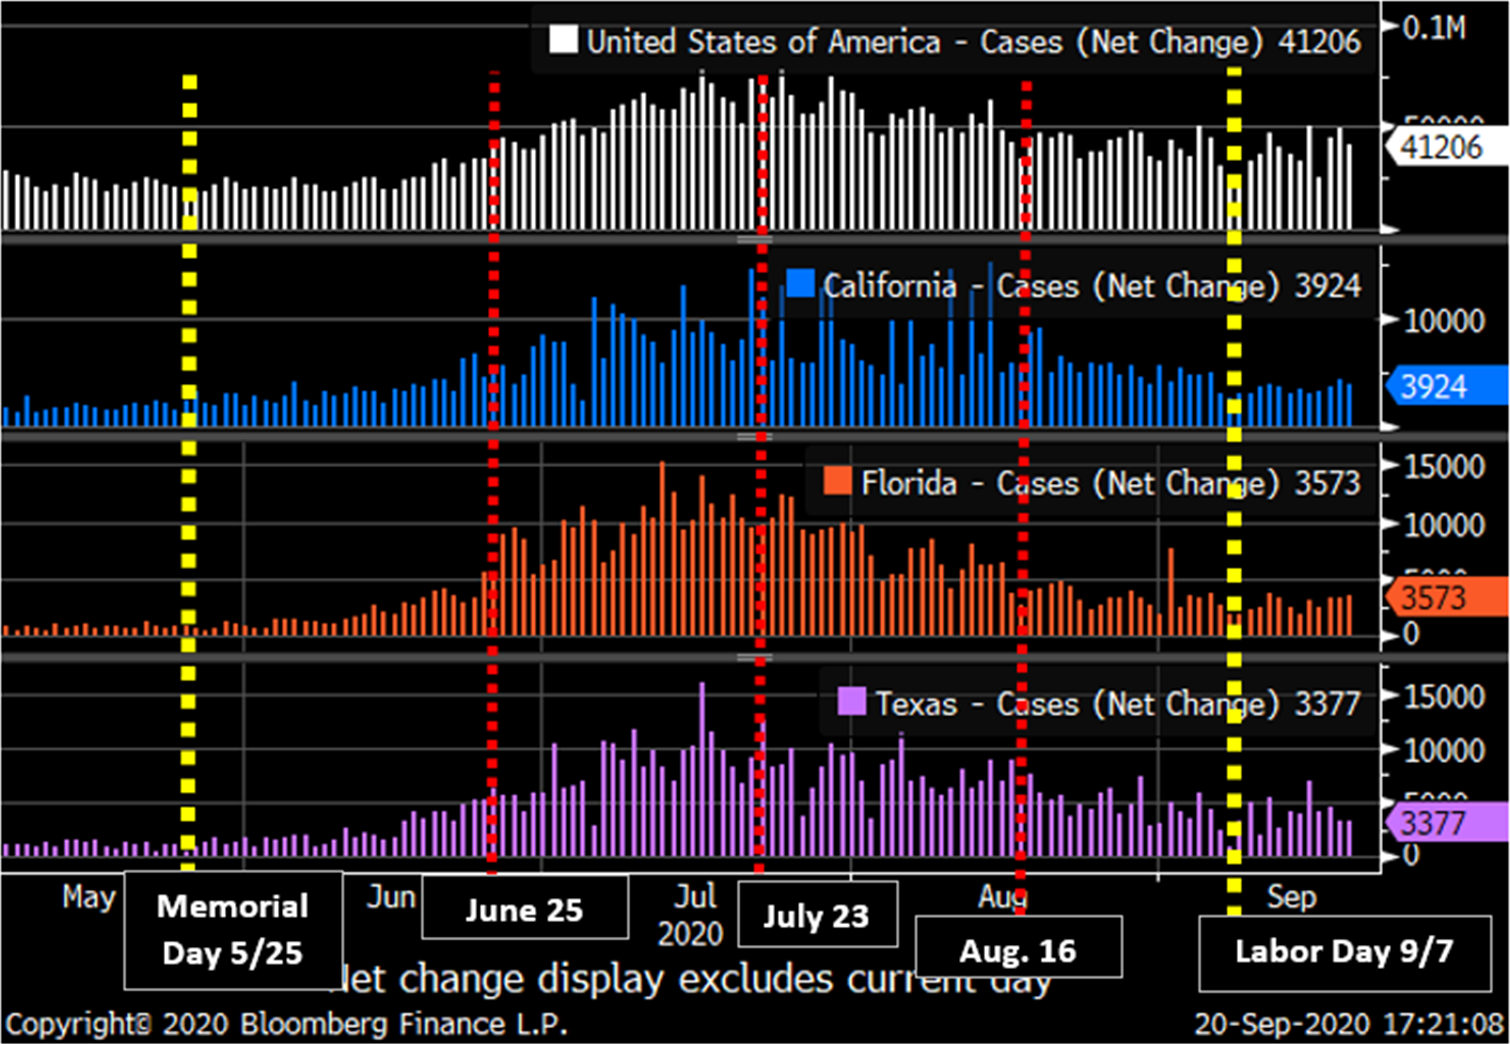
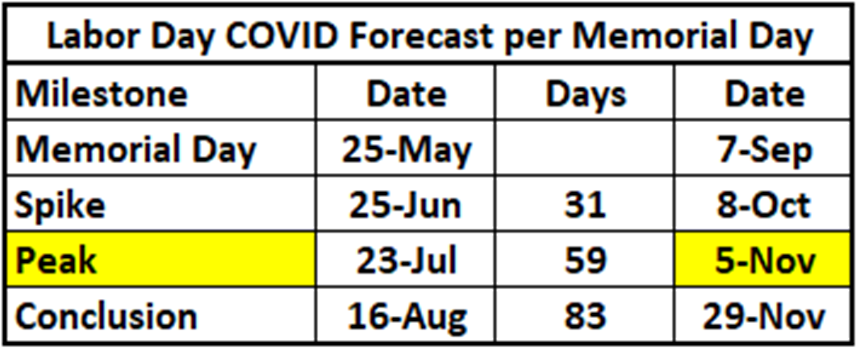
Extrapolating the same post Memorial Day timeline to Labor Day indicates the next wave is already occurring, will start to ramp up in early October, see rapid growth throughout October and peak right around the election.
Keep an eye on these developments as an indication of where flat rolled is headed for the rest of 2020.
Disclaimer: The content of this article is for informational purposes only. The views in this article do not represent financial services or advice. Any opinion expressed by Mr. Feldstein should not be treated as a specific inducement to make a particular investment or follow a particular strategy, but only as an expression of his opinion. Views and forecasts expressed are as of date indicated, are subject to change without notice, may not come to be and do not represent a recommendation or offer of any particular security, strategy or investment. Strategies mentioned may not be suitable for you. You must make an independent decision regarding investments or strategies mentioned in this article. It is recommended you consider your own particular circumstances and seek the advice from a financial professional before taking action in financial markets.


