

Prices

December 3, 2020
Midwest HRC Futures Enter Dangerous Four-Digit Territory
Written by David Feldstein
Editor’s note: SMU Contributor David Feldstein is president of Rock Trading Advisors. David has over 20 years of trading experience in financial markets and has been active in the ferrous futures space for over eight years. You can learn more at www.thefeldstein.com or add him on twitter @TheFeldstein and on Instragram at #thefeldstein.
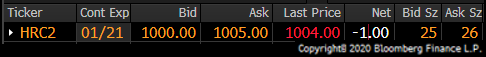
It now takes not three, but four digits to quote Midwest HRC.
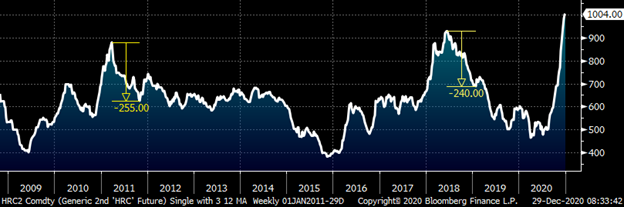
Set aside your personal situation for a minute and stand in awe of this rally. Looking back to the beginning of the CME Midwest HRC futures contract in 2008, there have been two other times the CME HRC future has seen a price spike like the one we are seeing now. In both cases, prices fell around $250 from peak to trough in the seven months after topping.
Rolling 2nd Month CME Hot Rolled Coil Future $/st
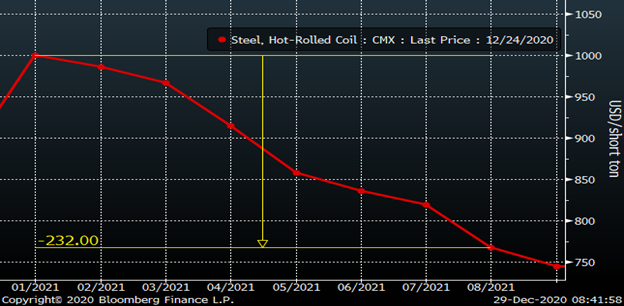
Below is the CME Midwest HRC futures curve with January at $1,000 and August, seven months after, at $768 or $232 below January. Interesting how that fits together.
CME Hot Rolled Coil Futures Curve $/st
While looking back at the spikes and tops in 2011 and 2018 for guidance, it still leaves us with the enormous challenge of identifying and timing when and at what price the current rally tops out. Moreover, I remind you that past performance is not indicative of future results both on the way up and way down. The current shortage-induced price spike, domestic supply/demand conditions and macroeconomics are incomparable to these previous periods. However, in my experience when markets are most turbulent, when fundamentals are thrown out the window, technical indicators become relatively more reliable. Like a sailor lost at sea, looking at the stars provides a rough guide to at least point the boat in the right direction.
With the mills so backed up, what could possibly stop this rally from climbing to $1,200, $1,500 or even one million dollars per ton? Perhaps nothing. However, like running a sprint, sustaining this speed, this rate of order entry, is exhausting and signs that it is losing momentum are starting to appear.
The current rally can be characterized in three phases:
1) Confluence of events – CLF acquisition of AMUSA assets, NLMK PA strike, Trump Q4 Brazilian slab reduction, etc. (August)
2) Chinese commodity rally/risk-on rally (post-election)
3) Supply squeeze further tightened by Q4 EAF planned maintenance, COVID outbreak at AMUSA Burns Harbor, Dofasco EAF accident and Stelco cyberattack (late November)
In the fourth quarter, global flat rolled prices also rallied due to similar supply-side production issues, although Midwest prices gained at a faster rate. This has resulted in domestic flat rolled priced at a (25% tariff adjusted) premium to international prices that have historically resulted in a surge of imported tons.
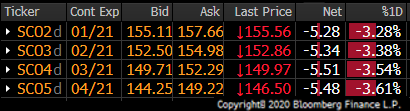
Chinese steel prices have also been rallying despite what looks to be excessive production relative to China’s lackluster economic data, especially in construction and declining automotive production/sales. Then, last week, the cover came off the ball as iron ore exploded above $175/t gaining $14 in one day! Chinese hot rolled futures followed at one point gaining over $50 for the week. However, iron ore and Chinese hot rolled futures have since turned abruptly lower giving back all of the gains and more. The table below shows the iron ore futures market for January through April 2021 at the close of China’s evening trading session (Tuesday a.m.).
The momentum in ore has rolled over and the rally is looking more like a blow-off top at this point. This chart is a textbook reversal with a 1) trendline break, 2) relative strength indicator moving from overbought to oversold (middle panel) and 3) the cross-over of the M.A.C.D (moving averages, lower panel).
SGX Iron Ore Futures Curve $ mt
Similar price action is occurring in the Chinese HRC futures market with the appearance of the dreaded “Evening Doji Star” bearish reversal pattern that generally follows a long uptrend. If you are unfamiliar with Japanese candlestick charting techniques, I will provide a more ferrous-focused name for this chart pattern: dumpster fire.
May (active) SHFE Chinese HRC Future $/st
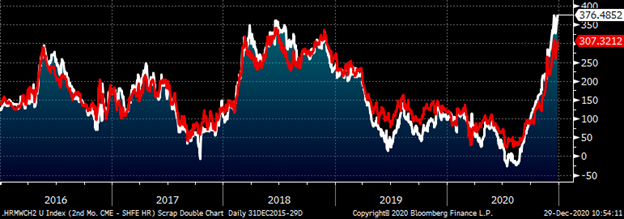
Whether looking at the spread between the CME Midwest and SHFE Chinese 2nd or 5th month futures, you see the spread has been stretched to previously excessive and unsustainable levels. If Chinese hot rolled falls, the spread blows out to new highs.
Rolling 2nd (wh) & 5th (red) Month CME Midwest HR – SHFE Chinese HR USD/st
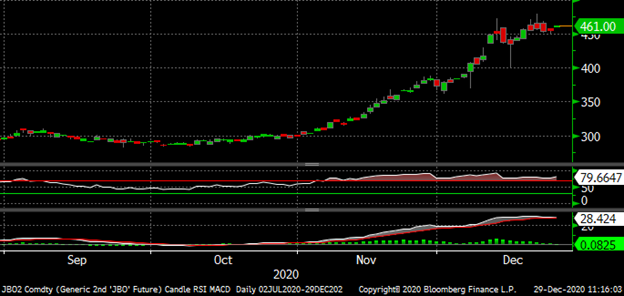
If iron ore continues lower, it will add downward pressure on the price of pig iron and Turkish scrap, which will likely exert downward pressure on busheling. (Note the current 2nd month Turkish Scrap future is January vs. February for busheling).
Rolling 2nd Month LME Turkish Scrap Future
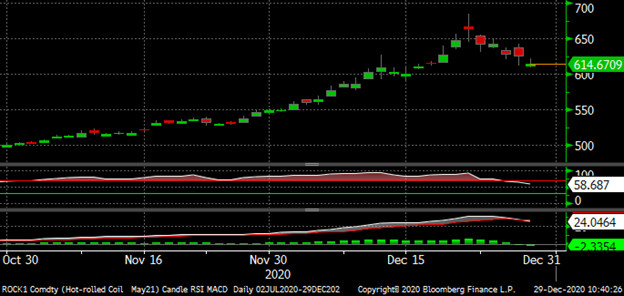
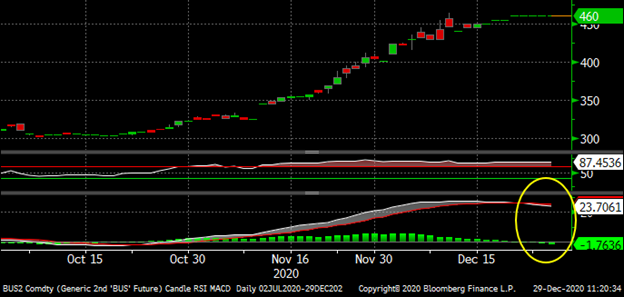
As all of this is happening globally, the MACD momentum indicator in the rolling 2nd month CME busheling future has turned negative.
Rolling 2nd Month CME Busheling Future $/gt
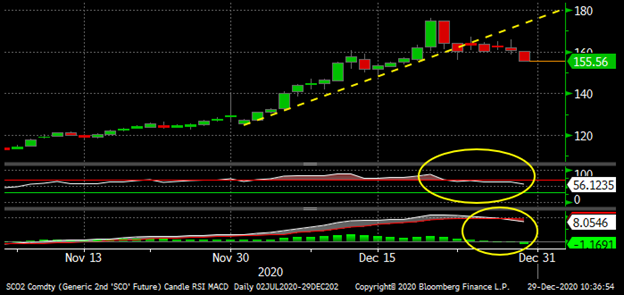
As has the MACD momentum indicator in the rolling 2nd month CME HRC future.
Rolling 2nd Month CME Hot Rolled Coil Future $/st
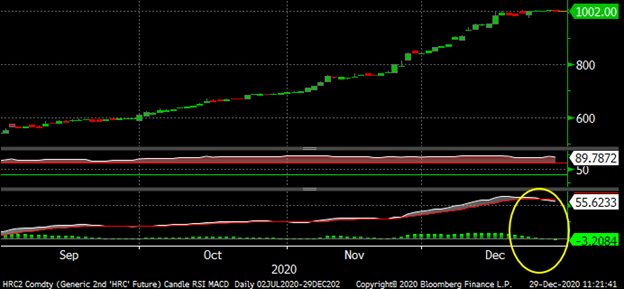
Technically, further signs of a breakdown than the change in momentum in the MACD’s of the CME Midwest HRC and busheling futures is needed, but this development is no doubt a shot across the bow, especially if Chinese ferrous markets continue to deteriorate.
As “The Most Dangerous Game” of musical chairs continues with what looks to be a $250/t Sword of Damocles hanging above the industry, I would be remiss if I failed to mention that there was a third instance where Midwest hot rolled was priced above $1,000/st. This episode started prior to October 2008, the first month the CME HRC futures first started trading. Thirteen years ago, physical Midwest HRC was trading around $550. By May 2008, the China-led commodity boom propelled Midwest hot rolled above $1,000/st. It held above $1,000 for four months from May through August 2008. By February 2009, seven months after peaking in July, it had fallen over $550/st to $500/st. It then continued falling until May 2009, when it bottomed below $400/st. While the decline was accelerated by the global financial crisis, it is one of only three times Midwest HRC has crossed above the $1,000/t threshold.
So, are you the hunter or the hunted?
Happy New Year…it is going to be an interesting one!
Disclaimer: The content of this article is for informational purposes only. The views in this article do not represent financial services or advice. Any opinion expressed by Mr. Feldstein should not be treated as a specific inducement to make a particular investment or follow a particular strategy, but only as an expression of his opinion. Views and forecasts expressed are as of date indicated, are subject to change without notice, may not come to be and do not represent a recommendation or offer of any particular security, strategy or investment. Strategies mentioned may not be suitable for you. You must make an independent decision regarding investments or strategies mentioned in this article. It is recommended you consider your own particular circumstances and seek the advice from a financial professional before taking action in financial markets.


