

Market Data

May 5, 2021
Manufacturing Indicators Continue to Show Improvement
Written by Brett Linton
U.S. industrial production, manufacturing and durable goods orders continued to show improvement from the coronavirus pandemic downturn through March and April data. The health of the manufacturing economy has a direct bearing on the health of the steel industry.
![]() The Industrial Production Index
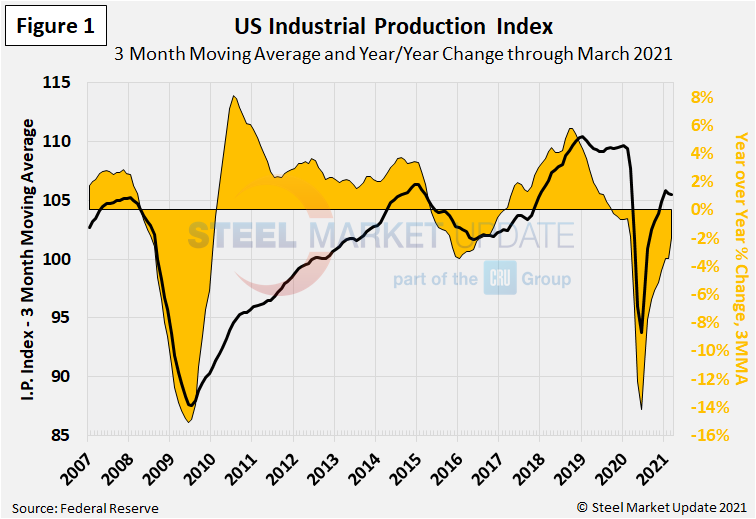
The Industrial Production Index
The IP index is a gauge of output from factories, mines and utilities. Industrial production took a serious hit from the shutdowns of nonessential businesses and other measures mandated by the government in the first and second quarters of 2020 to stem the spread of the coronavirus. Figure 1 shows the three-month moving average (3MMA) of the IP index since February 2007 as the black line and the year-over-year change in orange. We use the 3MMA calculations here to smooth out some of the monthly variability. From March through June 2020, the 3MMA of the IP index dropped by 14 percent, from 107.7 down to 93.7. The 3MMA recovered each month through February, slipping slightly in March to 105.5 and down 2.0% over the same period last year.
Manufacturing Capacity Utilization
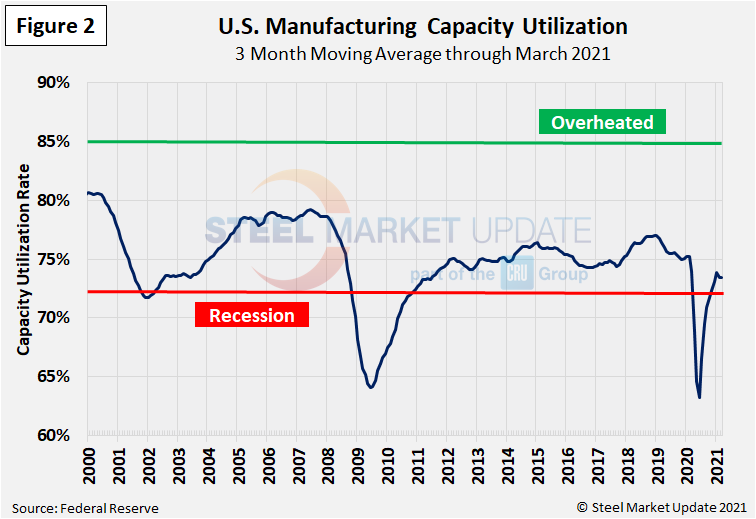
Manufacturing capacity utilization through March was measured at 73.4 percent as a 3MMA , the fifth month in a row outside of recessionary territory. The rate had hovered around 75 percent for most of the 2010’s, but began to decline in March 2020 and reached a low of 63 percent in June 2020 (Figure 2).
New Orders for Durable Goods
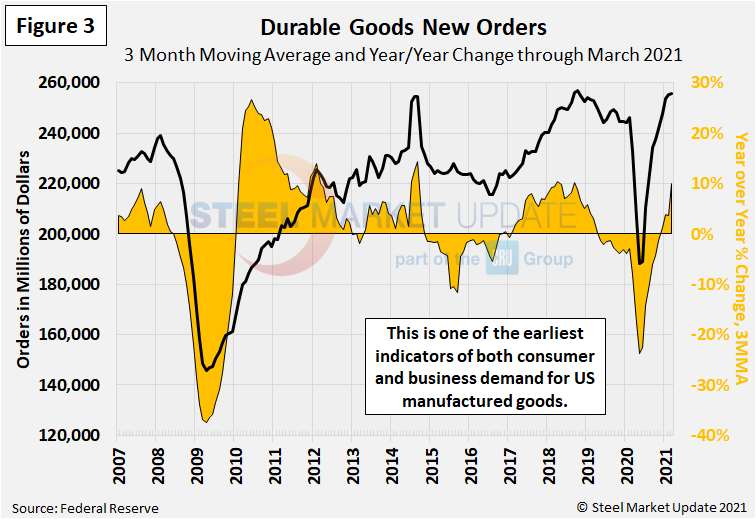
New orders for durable goods, an early indicator of consumer and business demand for U.S. manufactured goods, have recovered from the virus shock last year and are approaching record levels (Figure 3). The 3MMA dropped by 24% from February through May 2020, from a peak of $246.4 billion to a low of $188.4 billion. New orders increased to $256.0 billion as a 3MMA through March 2021, now at a 29-month high and very positive news for the economy.
New Orders for Manufactured Products
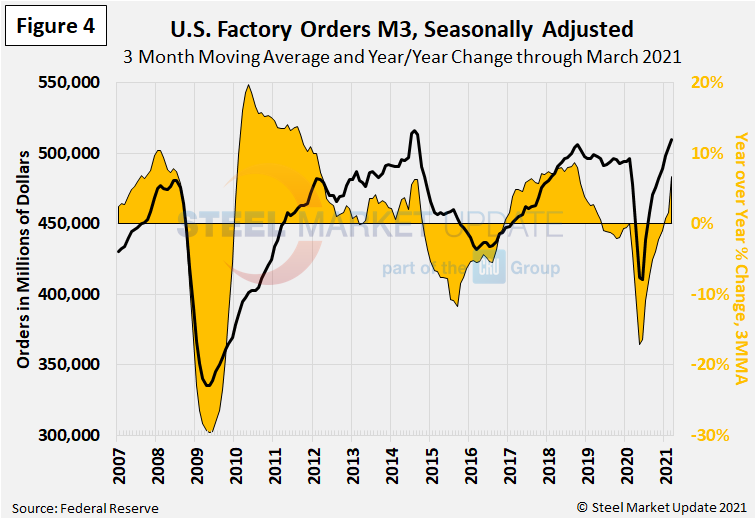
The growth rate of new orders for manufactured products as reported by the Census Bureau was slightly negative for most of 2019, then declined sharply in March through June 2020 (Figure 4). On a 3MMA basis, factory orders have increased each month since then, reaching $510 billion in March 2021. This is up 6.7 percent compared to one year prior, the highest annual rate of change seen since October 2018.
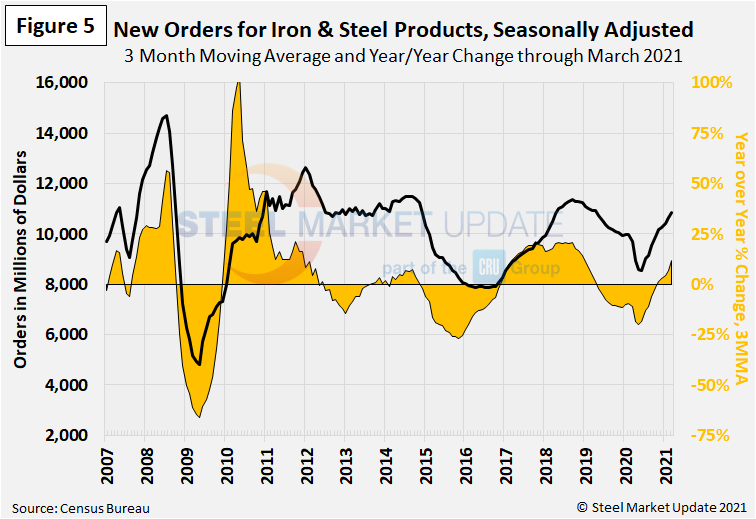
New Orders for Products Manufactured from Iron and Steel
Within the Census Bureau M3 manufacturing survey is a subsection for iron and steel products. Figure 5 shows the history of new orders for iron and steel products since February 2000 as a 3MMA. The 3MMA year-over-year growth rate, which reached negative 20.0 percent last May, rebounded to positive 11.8 percent in March at $10.9 billion. This is the highest annual rate of change seen since December 2018.
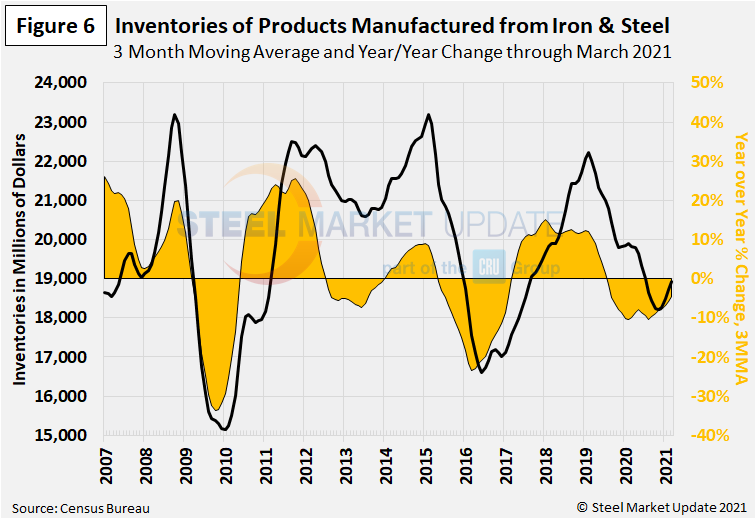
Inventories of Products Manufactured from Iron and Steel
Inventories of iron and steel products broke their multi-month decline streak in December 2020, and have risen each month since. The latest iron and steel inventory levels totaled $19.0 billion on a 3MMA basis in March, down 4.5% compared to the same period the year prior (Figure 6). The fact that new orders for manufactured goods were up while inventories of manufactured goods were down may reflect the tight availability and rising price of steel in late-2020.
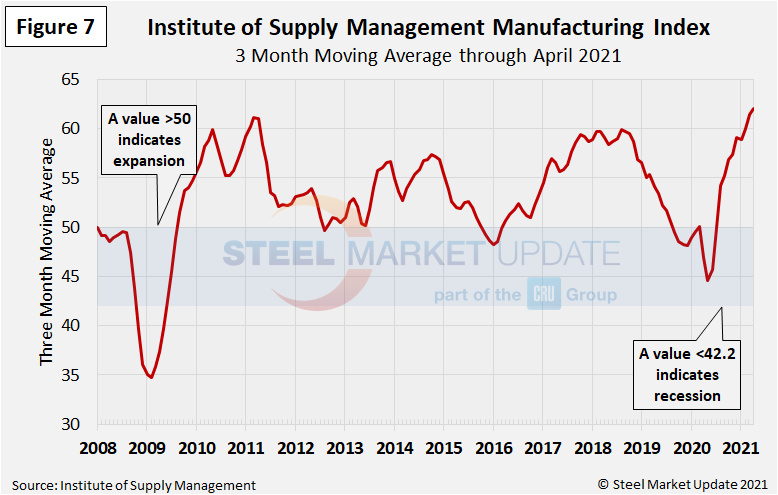
The ISM Manufacturing Index
The Institute for Supply Management’s Manufacturing Index is a diffusion index. An index value above 50 indicates that the manufacturing economy is expanding. As Figure 7 shows, the index on a 3MMA basis was in contraction territory from September 2019 through June 2020, but has recovered each month since then. The ISM index as a 3MMA now stands at 62.1 through April, the highest level seen since the record-high 3MMA reading of 62.4 in May 2004.
“Manufacturing performed well for the 11th straight month, with demand, consumption and inputs registering strong growth compared to March. Labor-market difficulties at panelists’ companies and their suppliers persist. End-user lead times (for refilling customers’ inventories) are extending. This is due to very high demand and output restrictions, as supply chains continue to respond to strong demand amid COVID-19 impacts,” said ISM Business Survey Committee Chairman Timothy Fiore.
By Brett Linton, Brett@SteelMarketUpdate.com


