Market Data

June 15, 2021
Service Center Shipments and Inventories Report for May
Written by Estelle Tran
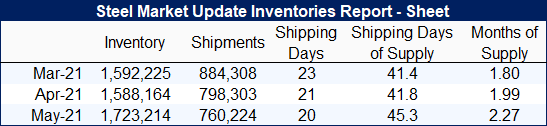
Flat Rolled = 45.3 Shipping Days of Supply
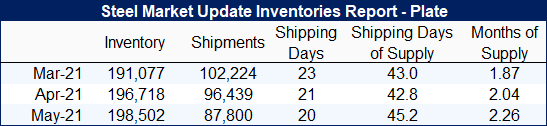
Plate = 45.2 Shipping Days of Supply
Flat Rolled
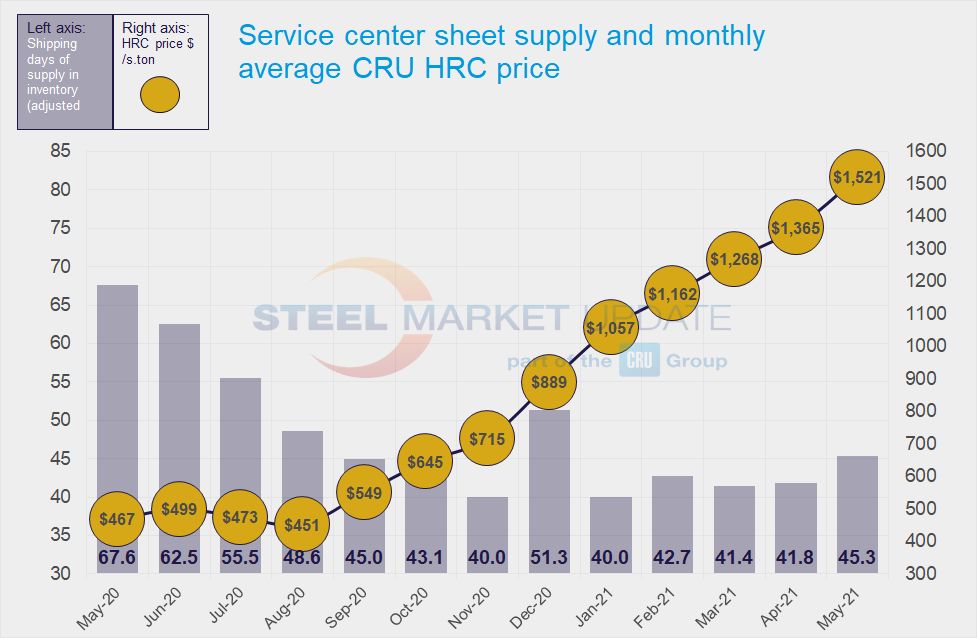
U.S. service center flat rolled inventories grew significantly in May as mills caught up on deliveries and intake increased. At the end of May, service centers carried 45.3 shipping days of supply on an adjusted basis, up from 41.8 in April. SMU data showed inventories represented 2.27 months of supply in May, compared to 1.99 in April.
Though inventories notably picked up in May, they were significantly below normal levels. In May 2019, service centers carried 55.6 shipping days of flat rolled supply.
Shipments were down about 5% month on month, which can be attributed to May having 20 shipping days to April’s 21. The daily shipping rate in May was flat compared to April. Historically, May has been the month when supply has been tightest when compared to outbound shipments.
The percentage of flat rolled inventory on order may have peaked in April, as on-order volumes eased back in May.
SMU’s latest lead time survey published June 10 showed mill HRC lead times at 10.63 weeks; this was the third consecutive survey with lead times over 10 weeks. Anecdotally, however, we have heard that mills have been catching up on orders, allowing customers to max out on their contract volumes. We have also heard that there have been some spot opportunities with shorter lead times than what has been advertised.
Service centers have in addition started to report some customer pushback against higher prices, which may be a sign that customers are not as desperate for material as they had been. Others continue to be able to pass on higher costs without issue.
On-order sheet volumes remain elevated along with extended mill lead times. But we expect the amount of material on order will fall through the summer as imports arrive.
May import licenses for carbon and alloy flat rolled products reached the highest level seen so far this year with 917,000 metric tonnes, according to Department of Commerce data. U.S. flat rolled imports from Jan-May 2020 totaled 3.23 million tonnes. Jan-May flat rolled imports in 2021 might total 3.85 million tonnes based on May license data and April preliminary import data–or a 19% year-on-year increase. Imports are expected to remain elevated through the summer, which will help to fill supply chains and return service center inventories to normal levels.
Plate
Service center plate inventories also started to build in May, though plate shipments dropped more than sheet. At the end of May, service centers’ plate supply reached 45.2 shipping days of supply on an adjusted basis, up from 42.8 in April. Plate inventories represented 2.26 months of supply in May, up from 2.04 in April.
Shipments decreased 9% month on month, though contacts have reported seeing service centers and fabricators unable to get all the steel they need. The latest SMU survey reported plate mill lead times at 9.7 weeks, up from 9.43 weeks two weeks prior. Buyers are still reporting delays.
With inventories still lean for plate, on-order volumes have been rising.
Prices continue to rise for plate and are expected to increase more with scrap and flat rolled prices. With higher prices and extended lead times, intertrade among service centers remains the norm as centers seek to fill holes for certain products. Market contacts reported cautious optimism on increasing numbers of projects to quote, rising prices, and more demand from the heavy equipment, wind, construction and energy sectors