

Market Data

August 15, 2021
Shipments and Supply of Steel Products Gained Ground in June
Written by David Schollaert
Mill shipments of steel products rose in June by 1.7%, following an increase of 1.9% the month prior. Apparent supply jumped 6.0% in June after a 1.3% increase in May. June’s gains were the fourth in as many months after February’s double-digit contraction.
This analysis is based on steel mill shipment data from the American Iron and Steel Institute (AISI) and import-export data from the U.S. Department of Commerce (DOC). The analysis summarizes total steel supply by product from 2008 through June 2021 and year-on-year changes.
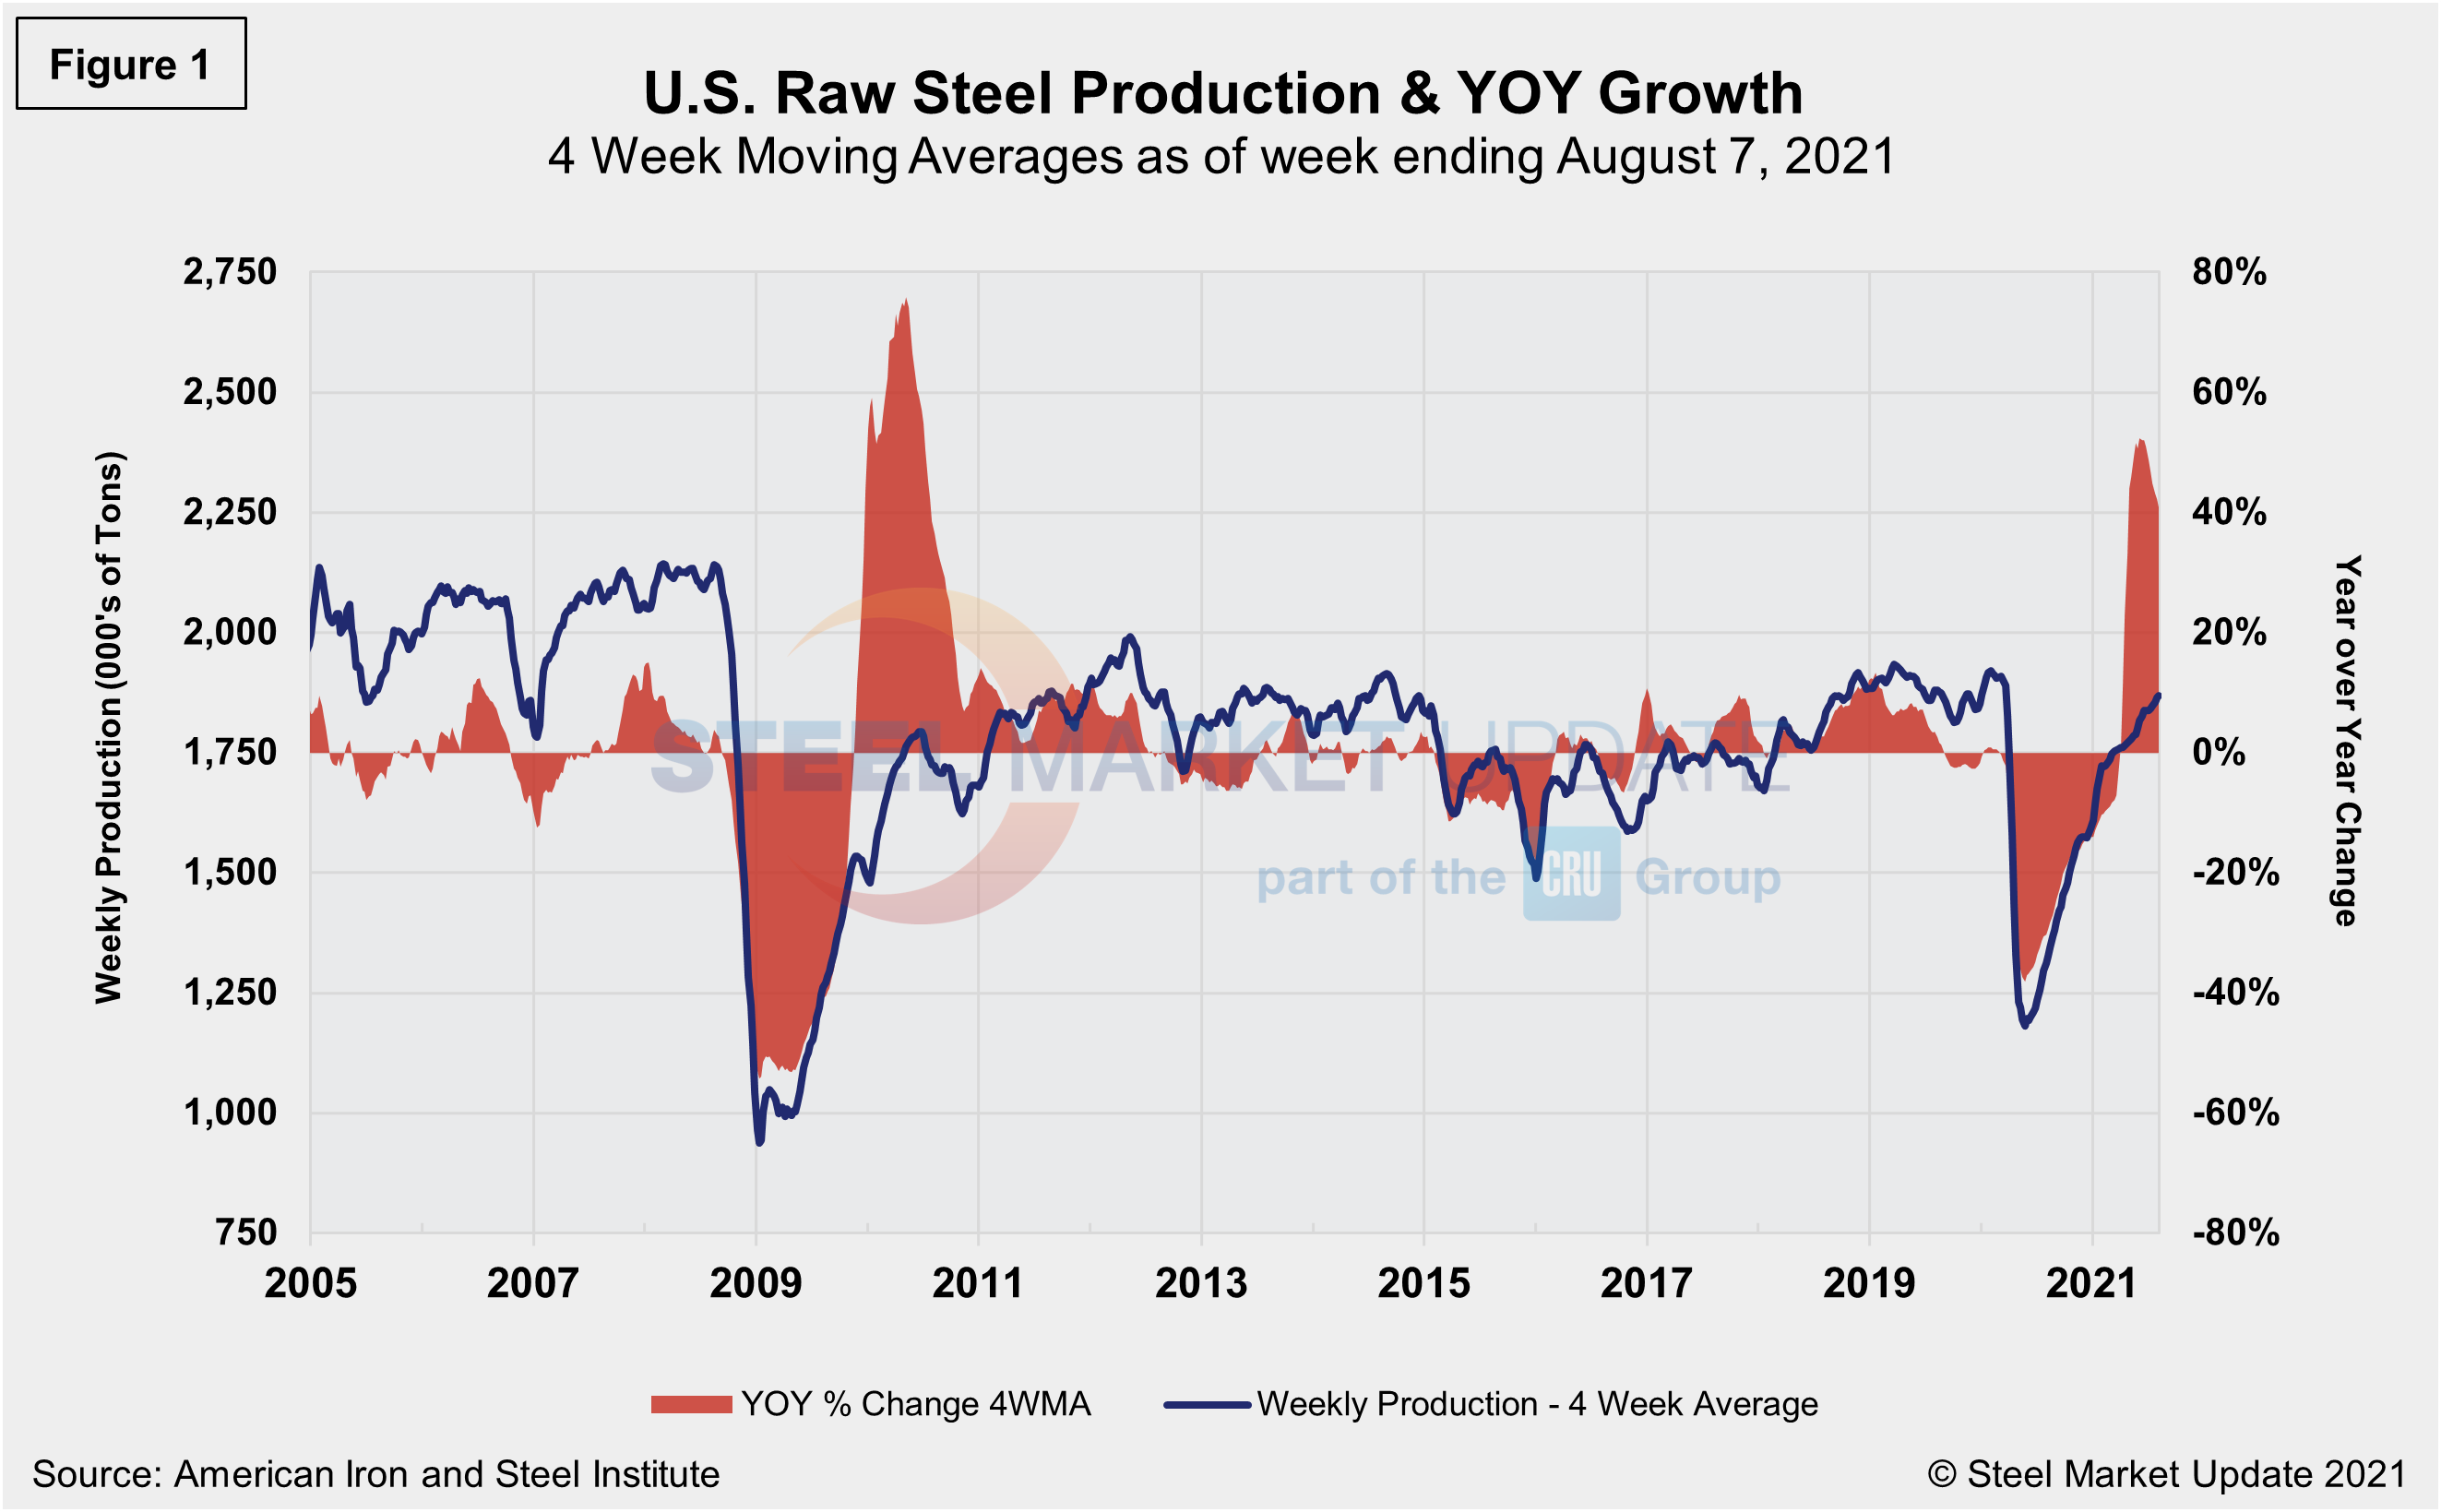
Ongoing supply limitations and strong demand continue to push steel prices to record heights. While domestic mill utilization is hovering around 85% on average and mills are running at near capacity, steel supplies, including domestic production and imports, continue to lag demand, extending the price rally for 12 straight months. SMU’s benchmark hot-rolled coil price stood at a record $1,900 per net ton as of Aug. 10, a shocking 78% higher than the previous record of $1,070 per ton seen in the summer of 2008. Raw steel production shown below in Figure 1 is based on weekly data from the AISI and displayed on four-week moving averages.
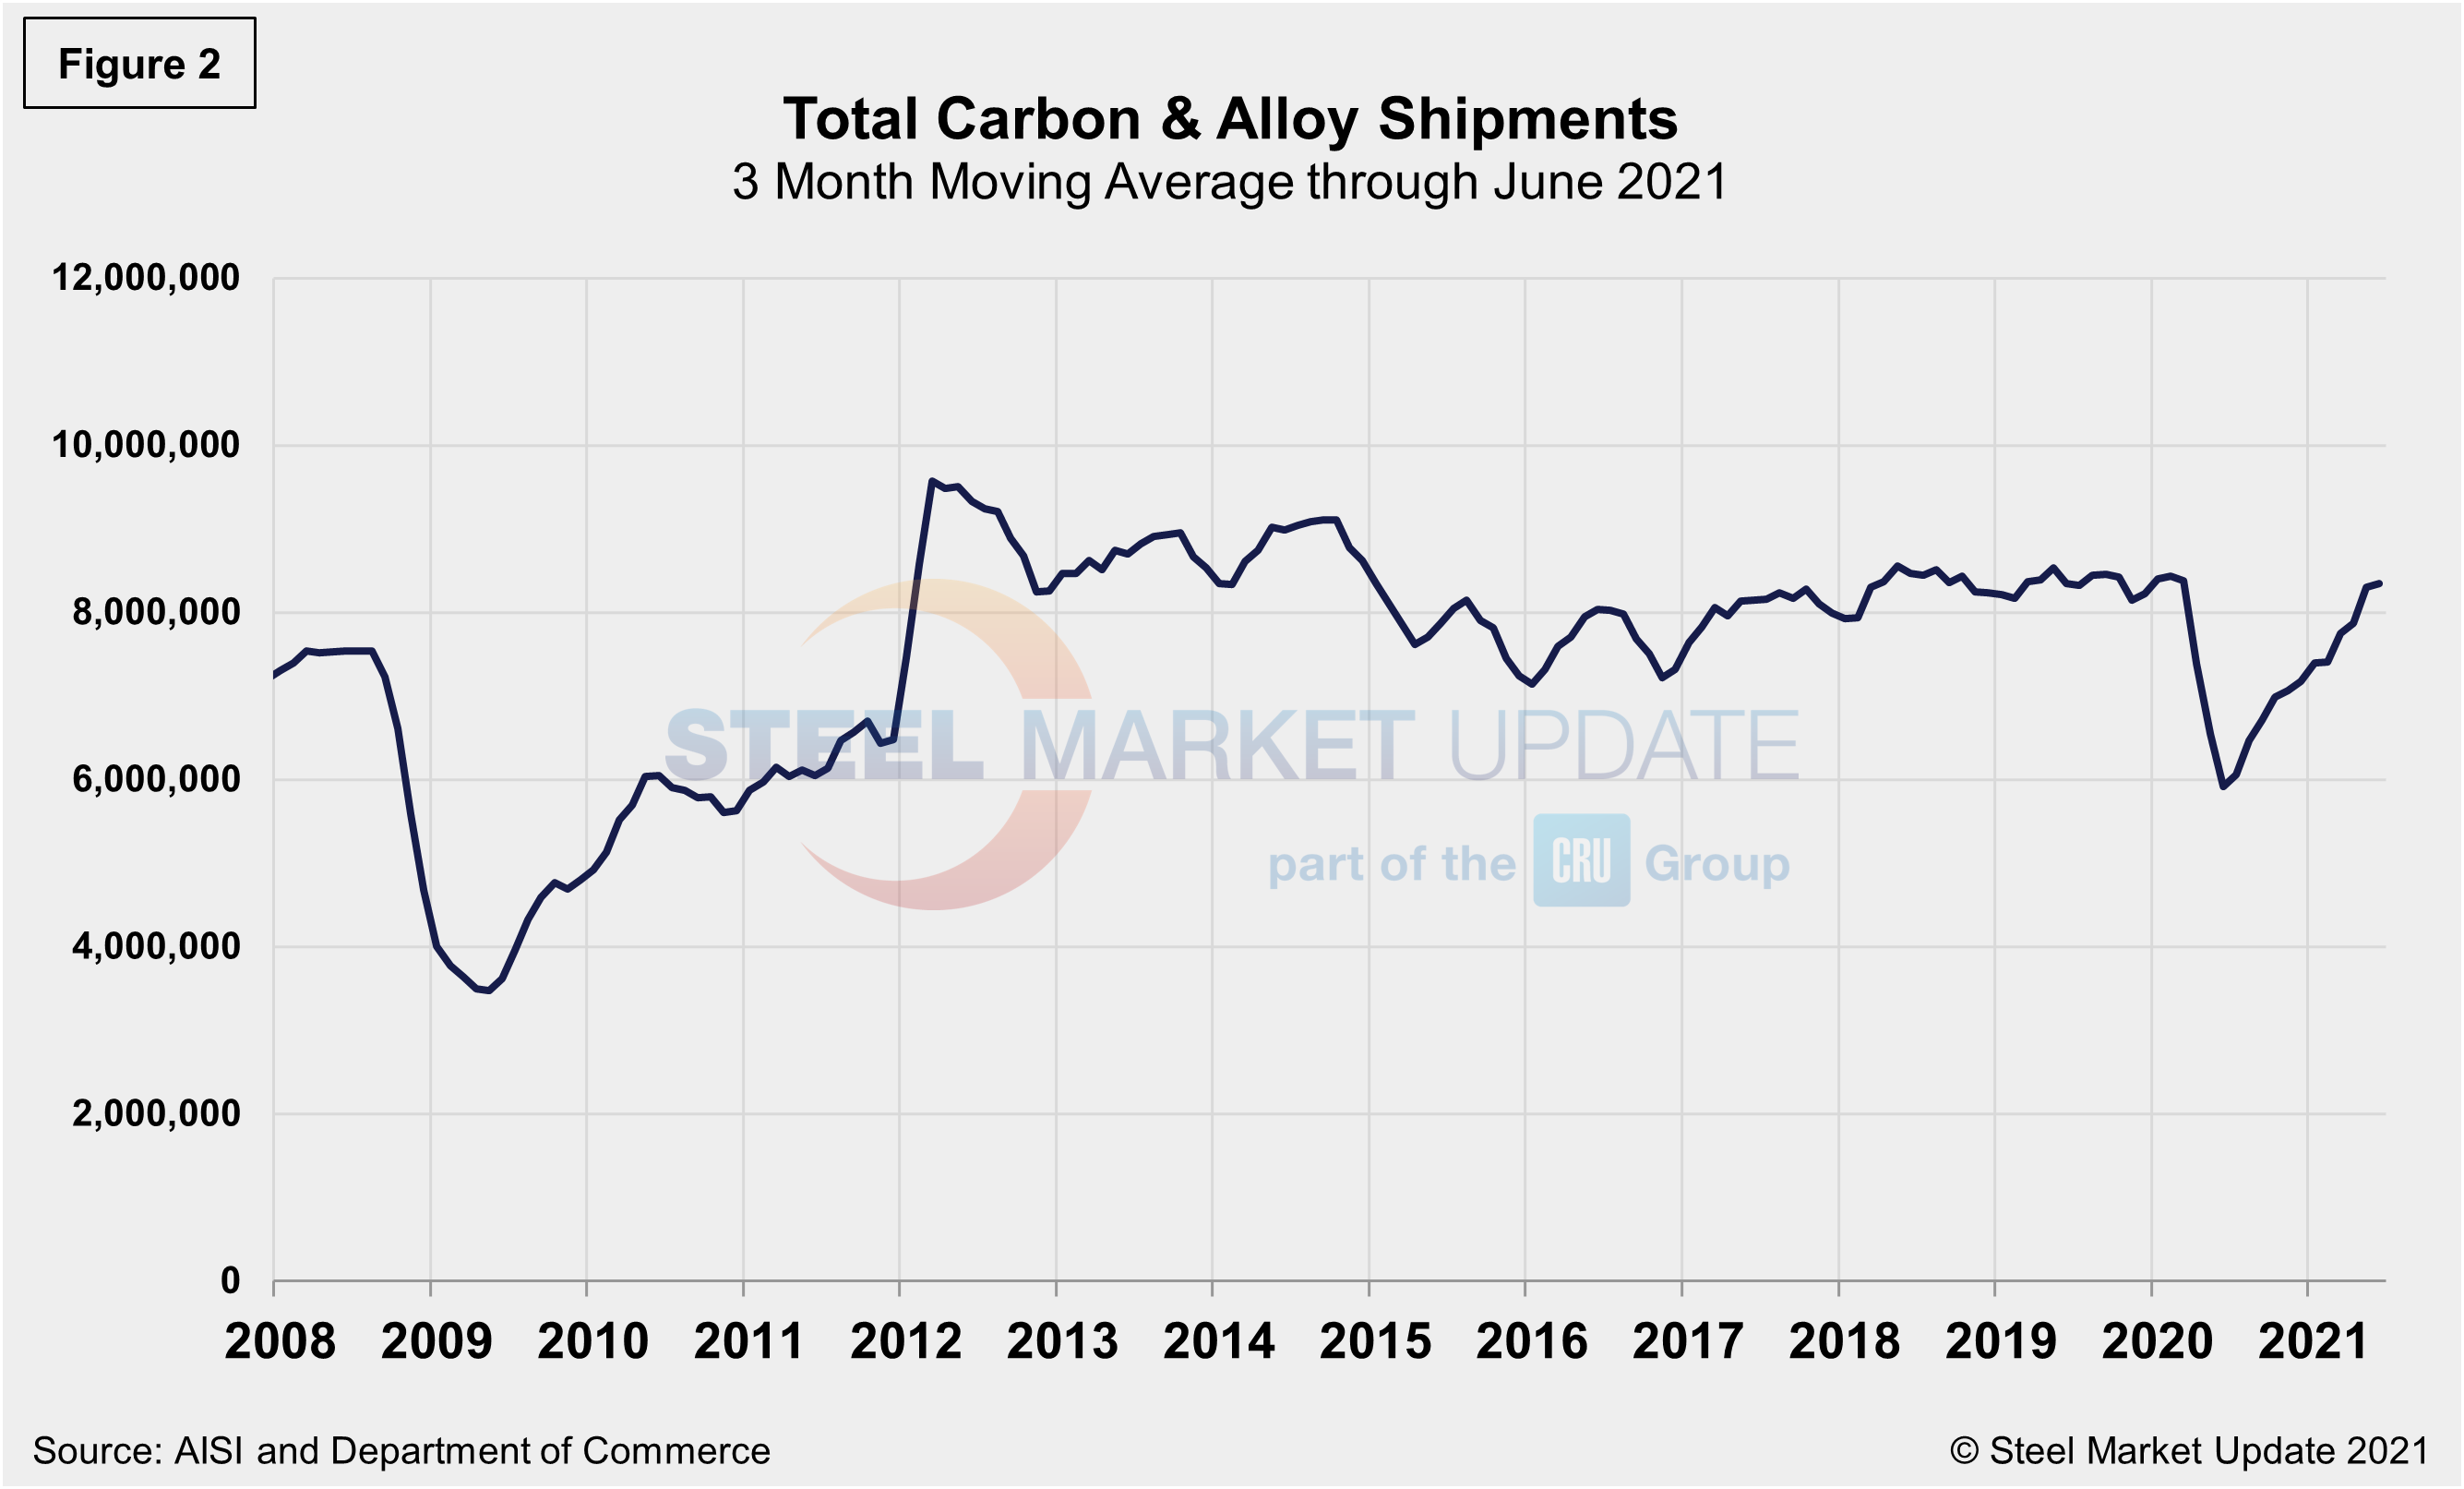
Monthly shipment data for all rolled steel products is noted in Figure 2. The trajectories of the rebounds since Q2 2020 are comparable in Figures 1 and 2. Measured as a three-month moving average (3MMA) of the monthly data, June’s total was 8.542 million tons, compared to 8.397 million tons in May, an increase of 1.7%. Shipments were up 35.5% in June compared to the year prior when shipments were 6.302 million tons. The recovery from the debilitating COVID-driven blows has been significant, as current shipments are up 5.6% from the same pre-pandemic period in 2019.
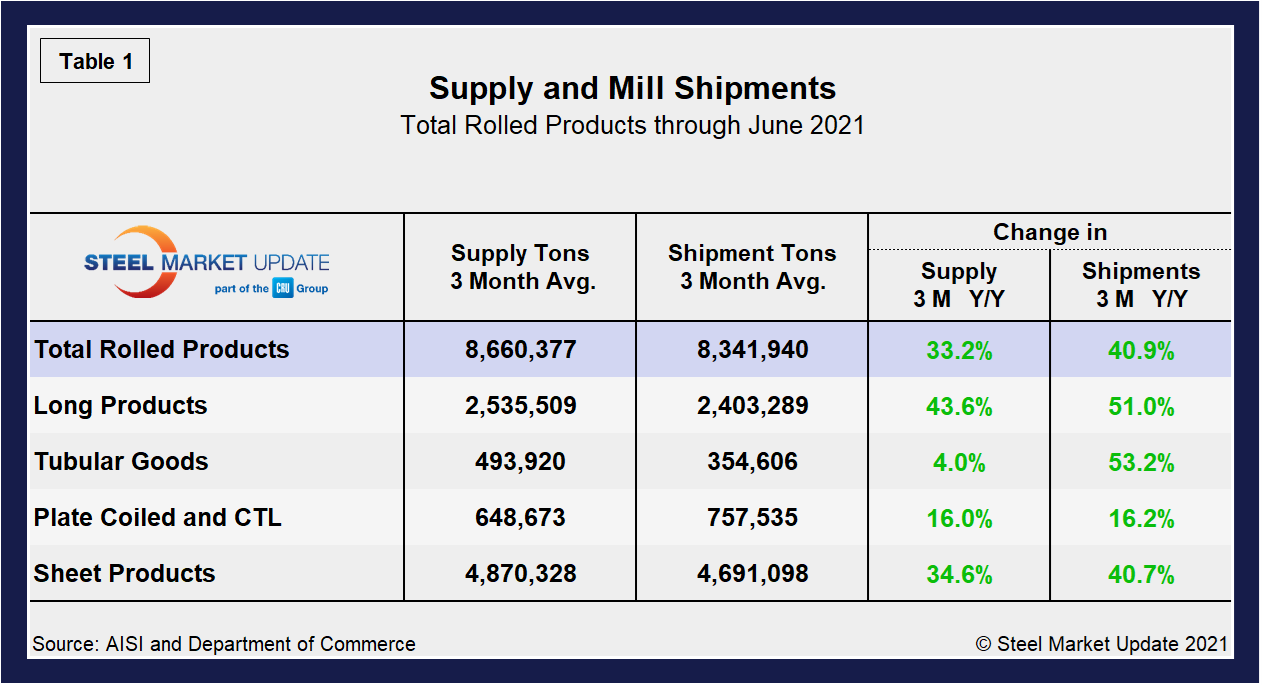
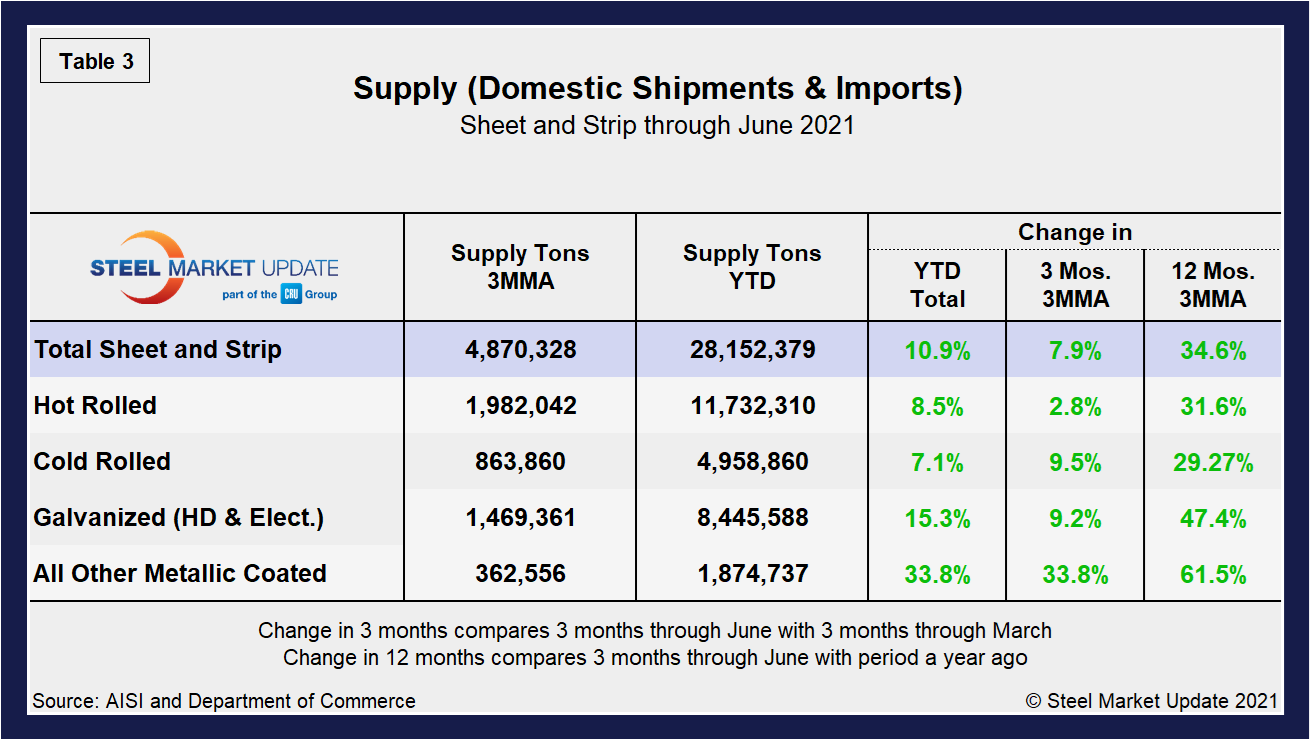
Shipment and supply details for all product groups are noted in Table 1, followed by individual sheet products in Table 2, and domestic supply (shipments and imports) in Table 3. Total supply (proxy for market demand) as a 3MMA was up 33.2% year over year in June, a big turnaround from the 28.1% decline last June when the market hit bottom. Apparent supply is defined as domestic mill shipments to domestic locations plus imports. Mill shipments improved by 40.9% in June, up from 26.9% in May in the three-month comparison. The recovery has varied significantly among various products, with tubular goods lagging most others.
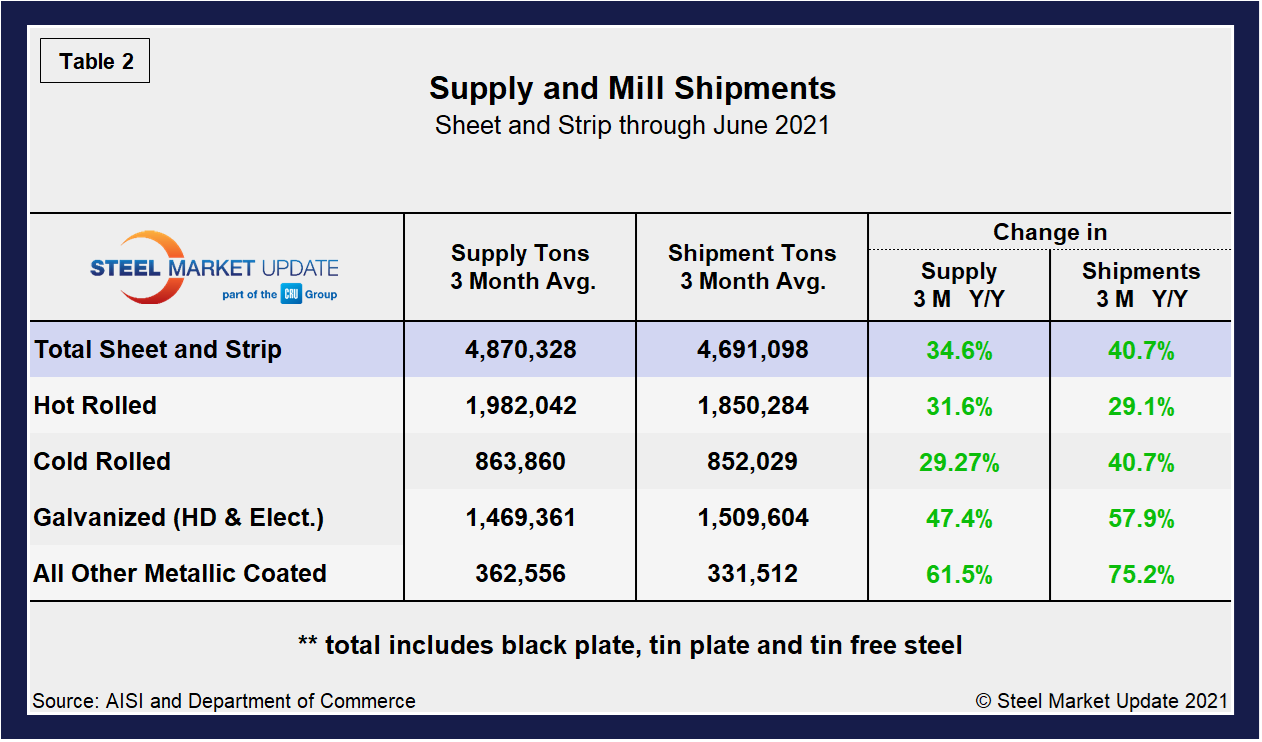
Overall sheet product shipments and supply (Table 2) have improved markedly month on month. Supply increased by 34.6% and shipments by 40.7% in June, a strong recovery from declines of 7.5% and 6.5% just this past March. In the three months through June 2021, the average monthly supply of sheet and strip was 4.870 million tons, a marginal increase from 4.866 million tons or just 0.1% from the prior month. Total sheet and strip apparent supply is up 10.9% year to date (Table 3) compared to 2020. Note that year-over-year comparisons have seasonality removed.
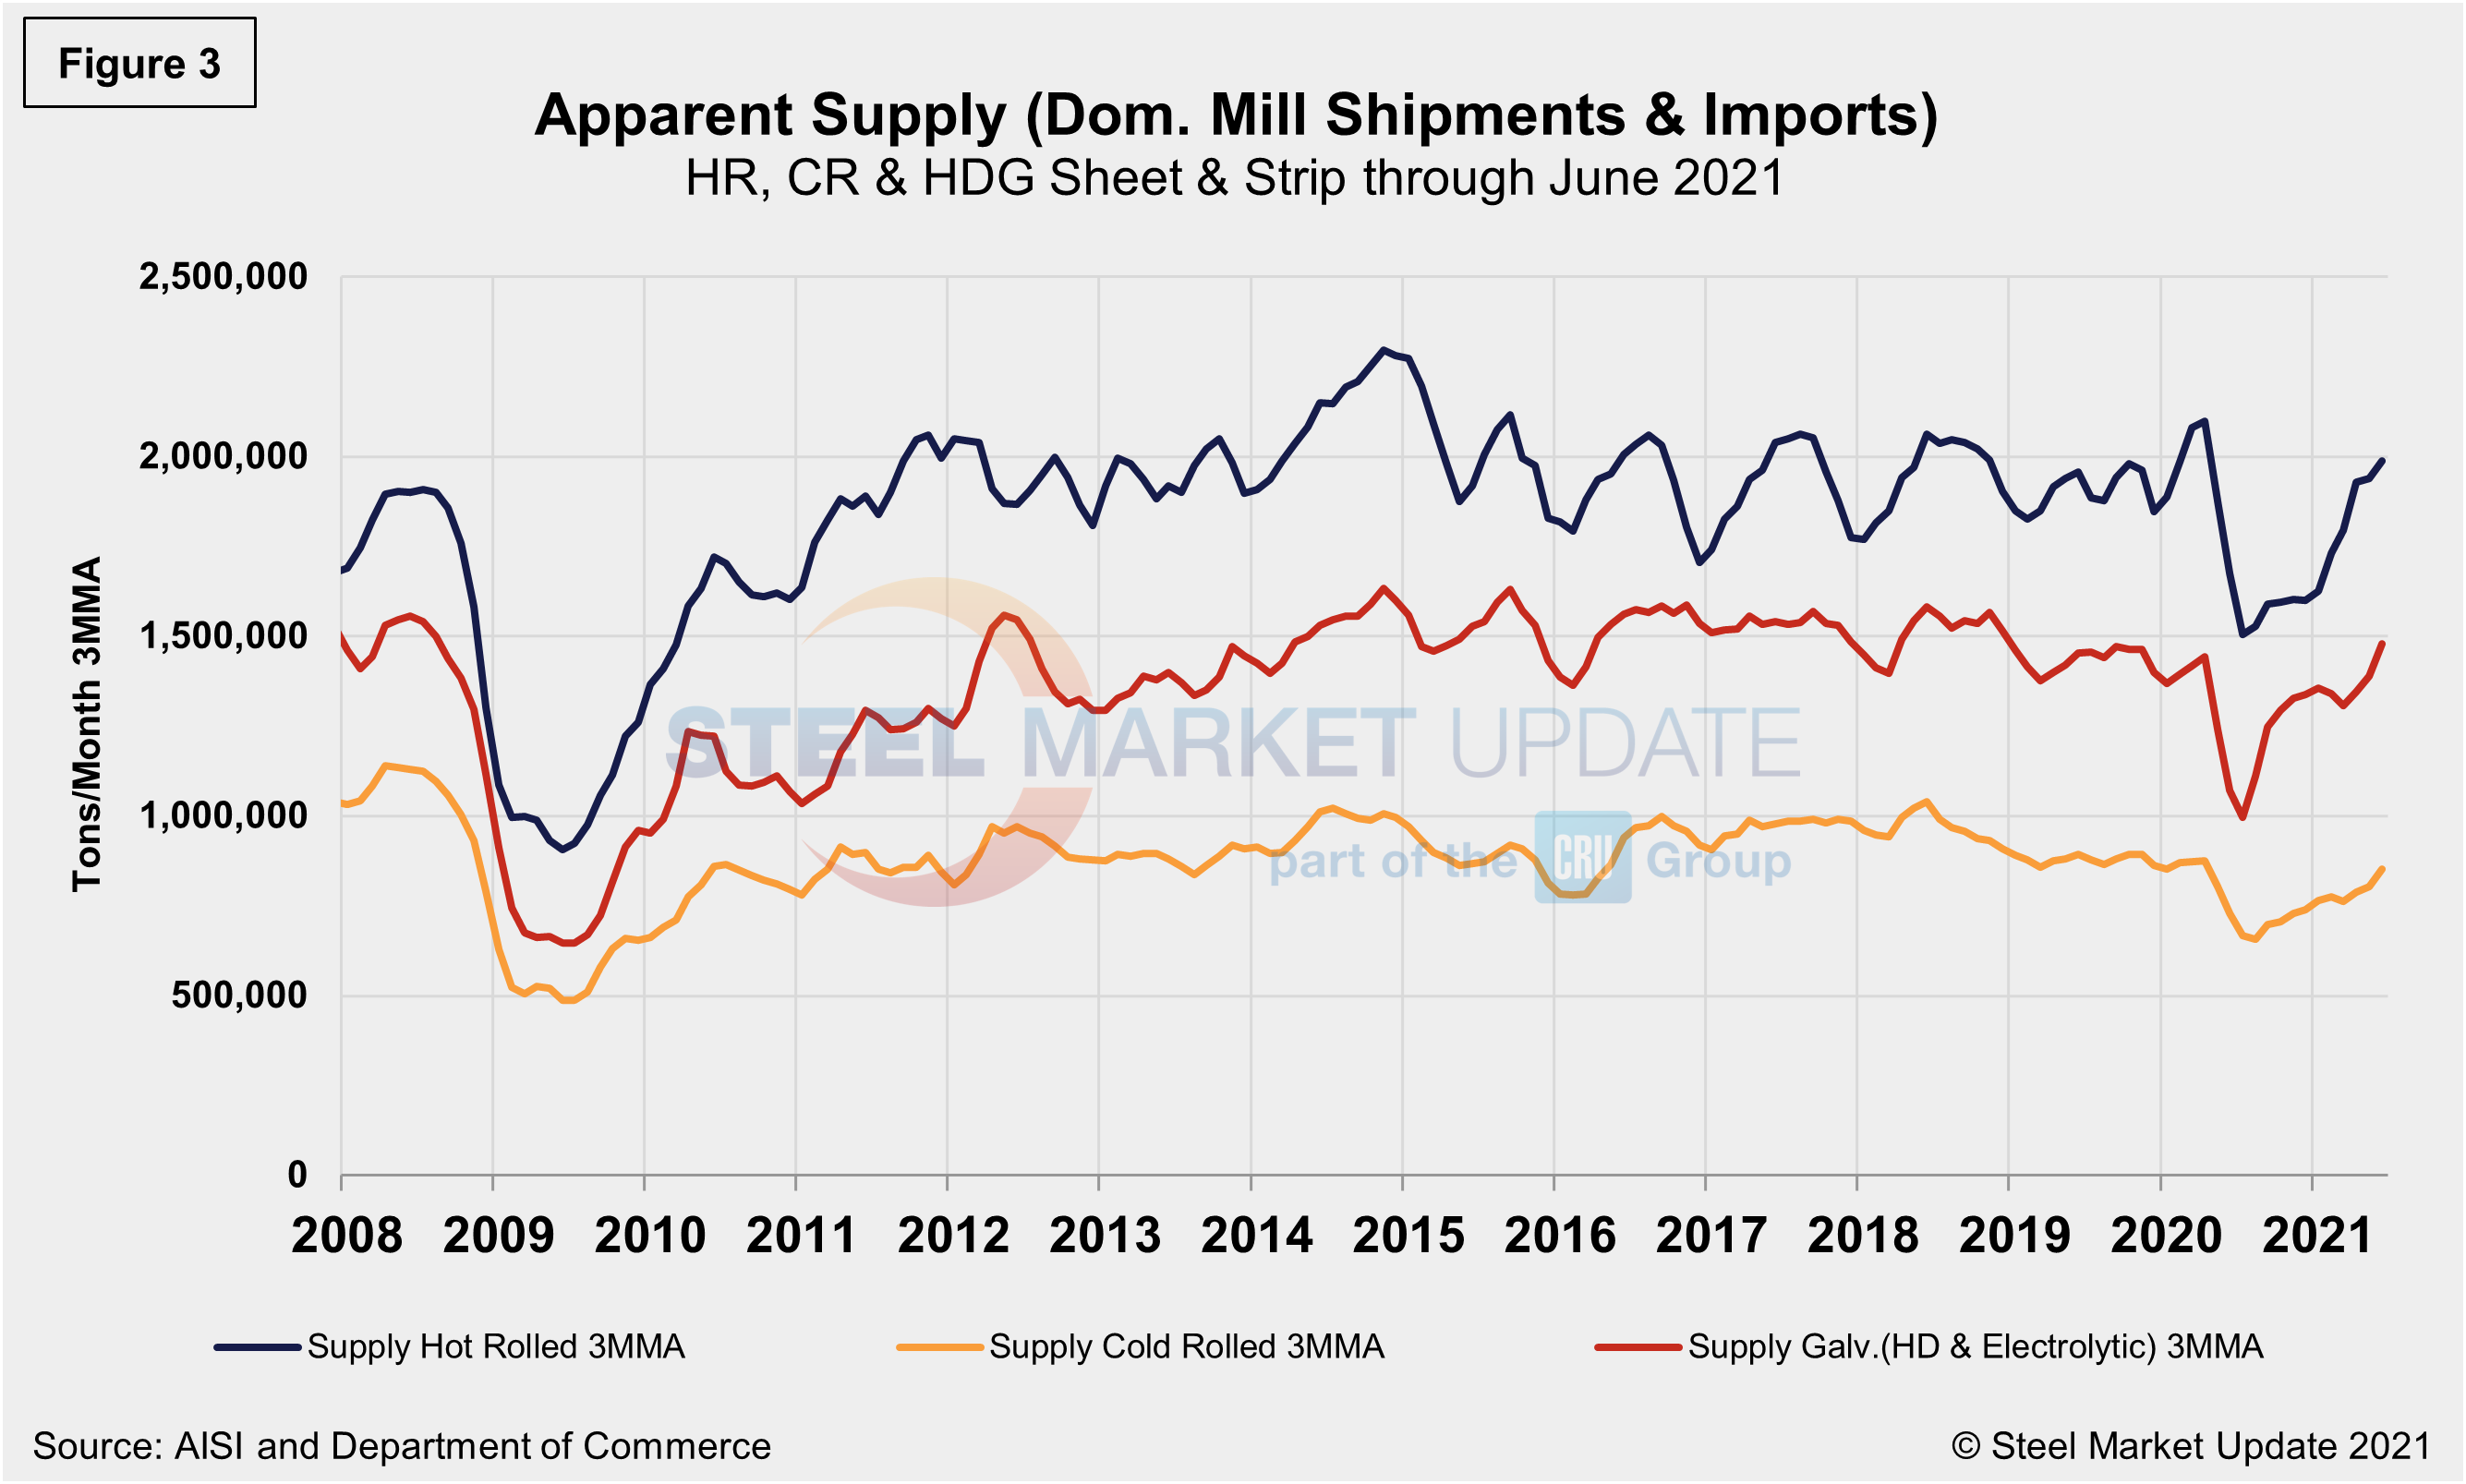
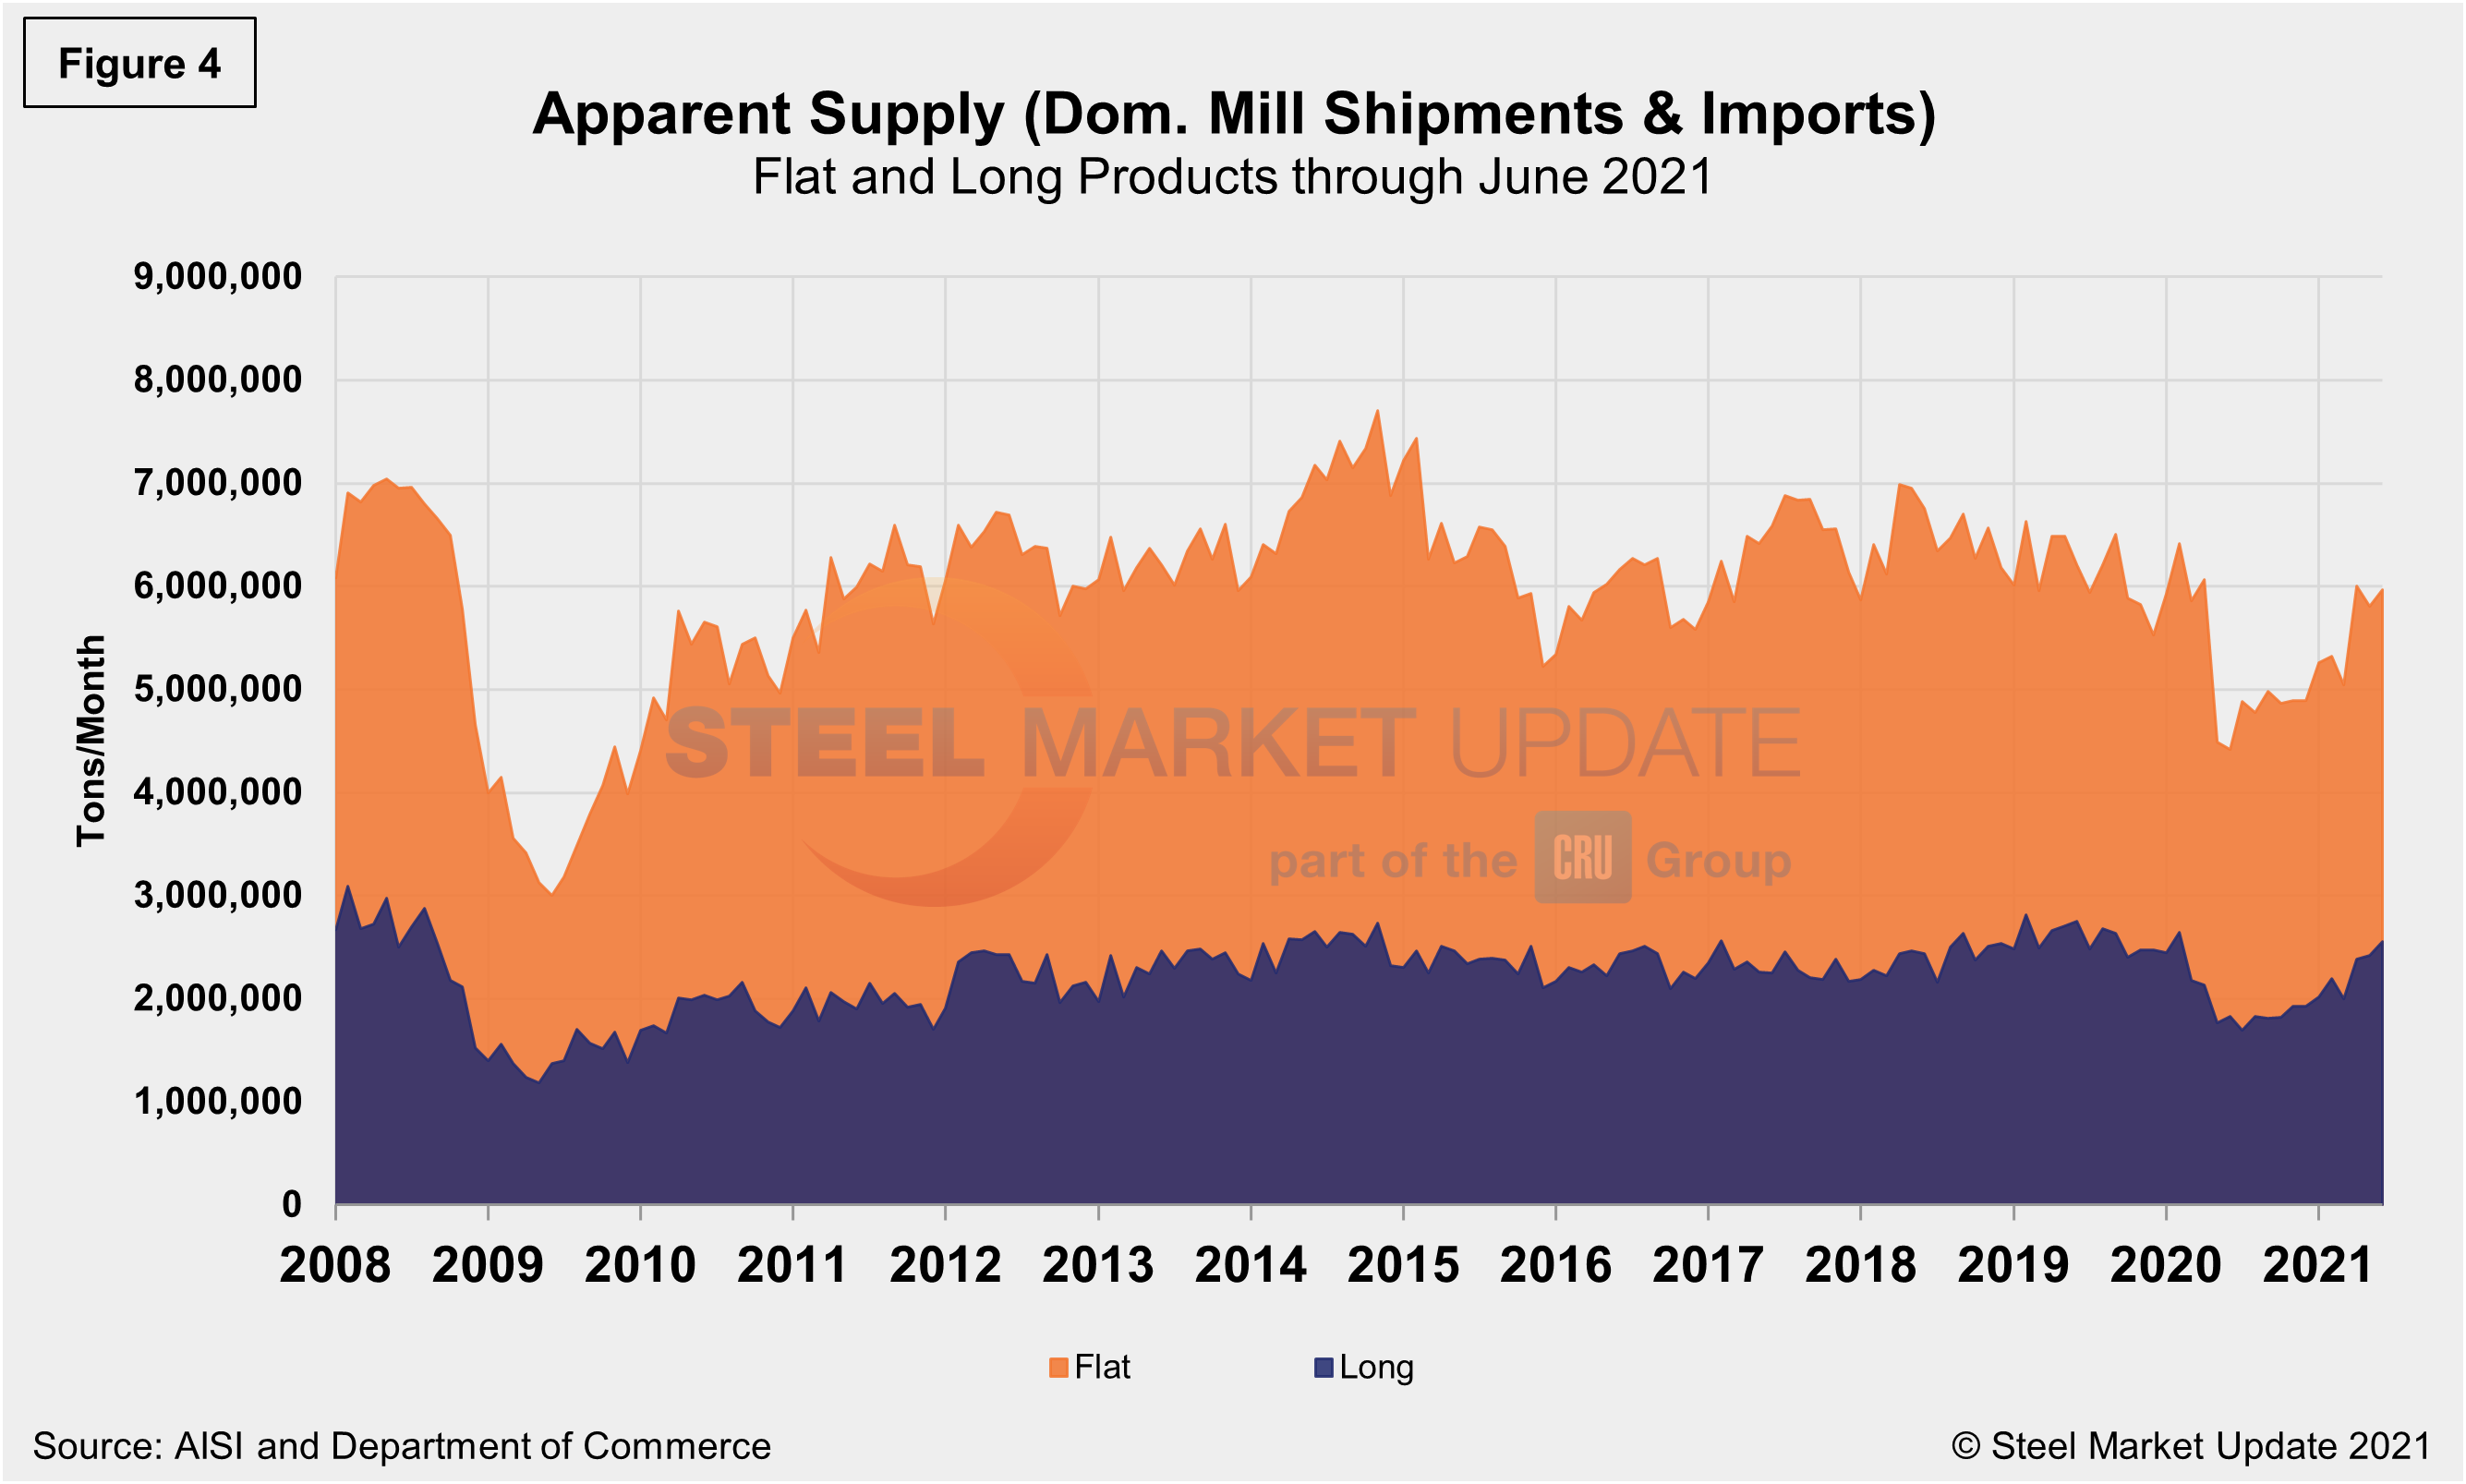
The supply picture for HRC, CRC and HDG since August 2008 as three-month moving averages in Figure 3 and Figure 4 show the long-term comparison between flat and long products. All three sheet products have experienced some improvement since mid-2020, but cold rolled has seen the strongest rebound, a 32.6% jump since reaching bottom in June 2020, but up just 1.2% month on month in June following an increase of 7.0% the month prior. In Figure 4, note that these are monthly numbers (not 3MMAs), which show the trend difference between longs and flat products including plate.
By David Schollaert, David@SteelMarketUpdate.com


