

Market Data

August 20, 2021
SMU Steel Buyers Sentiment: Post-Conference Pop?
Written by Tim Triplett
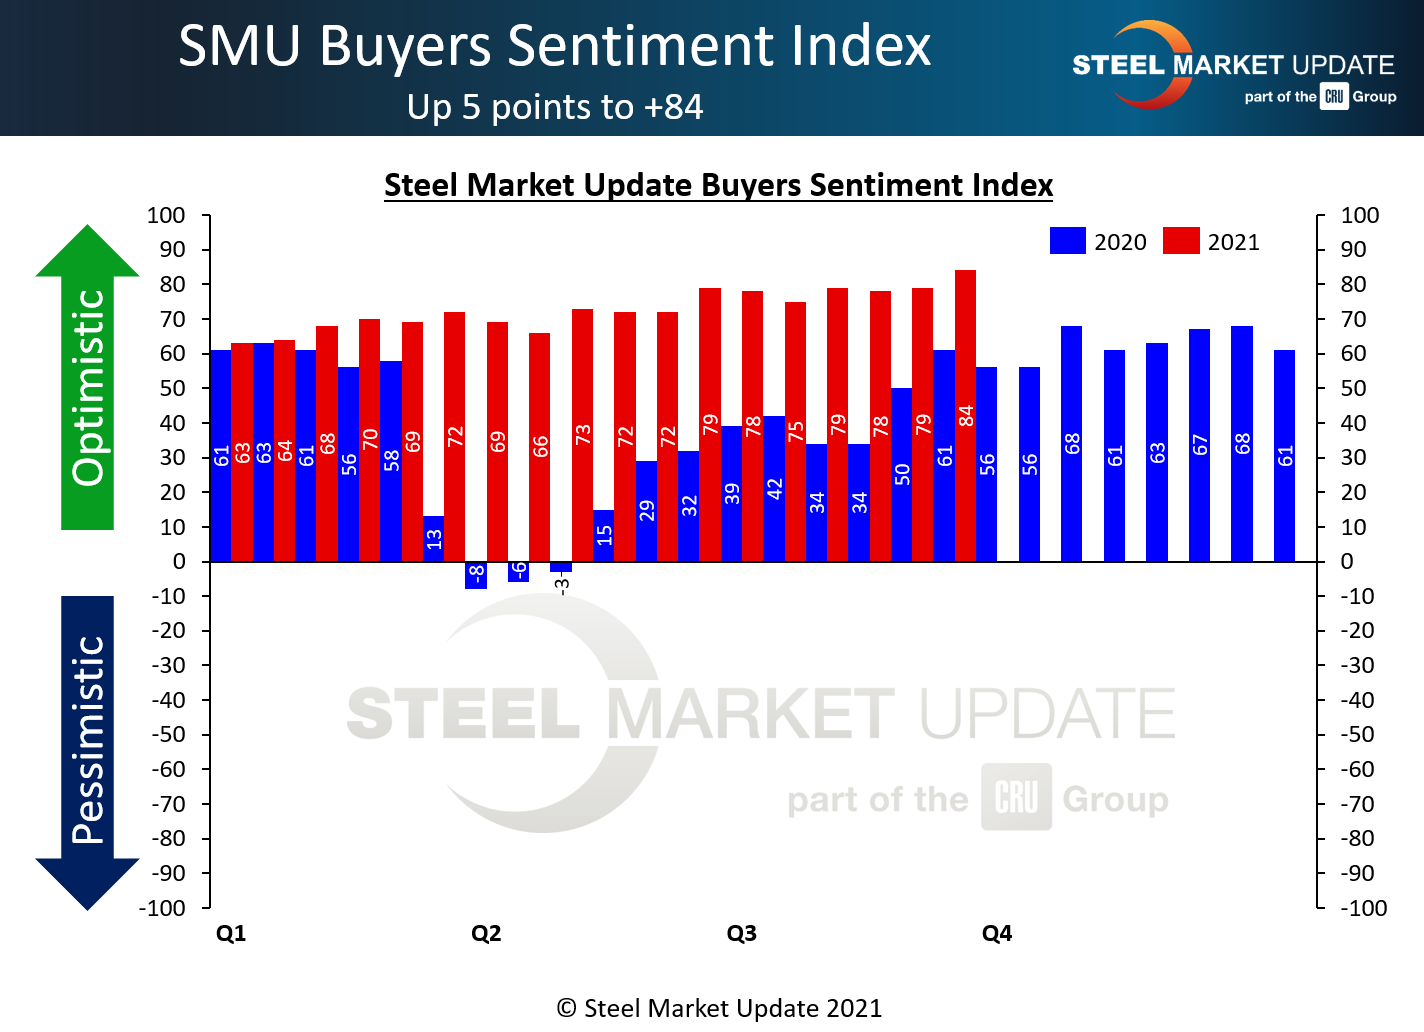
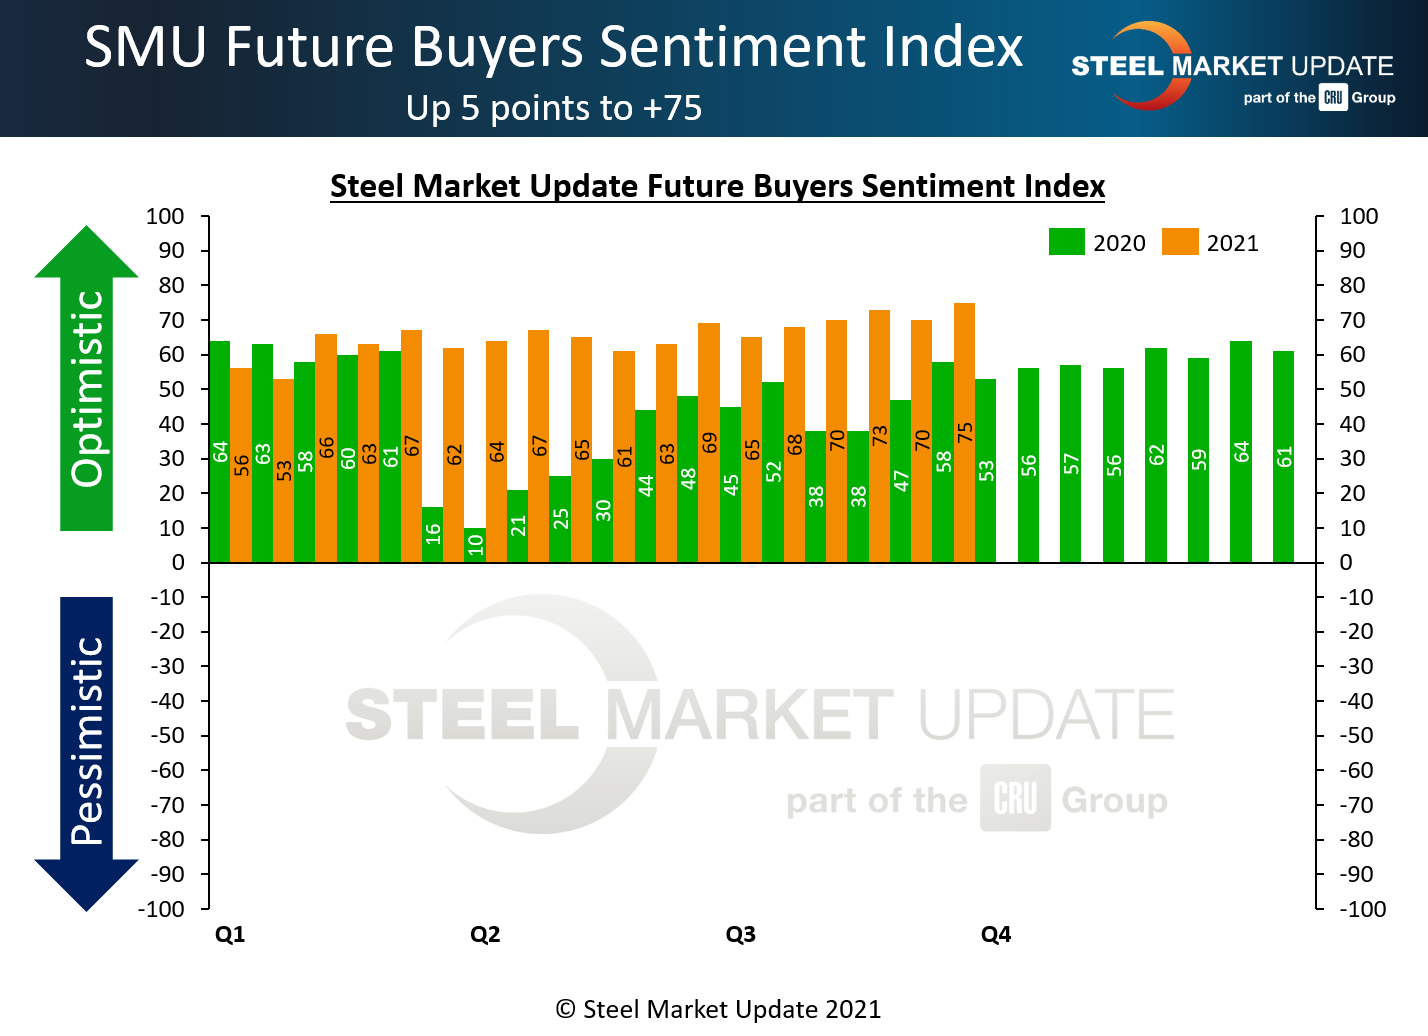
Steel Buyers Sentiment, as measured by Steel Market Update, has never been higher despite concerns over the latest COVID variant and signs that the rate of rise in steel prices is beginning to slow. SMU’s Current Sentiment Index registered a new all-time high of +84 this week – the first time the index has broken into the eighties – while the Future Sentiment Index hit +75, just two points below its record high of +77 seen in February 2018.
SMU asks steel buyers every two weeks how they view their company’s chances for success in the current environment and how they view their prospects three to six months in the future. The high level of optimism is somewhat surprising given the various uncertainties the market is facing.
We believe the results may have been skewed by the large attendance at SMU’s Steel Summit in Atlanta last week. Many of the respondents to our survey were among the 1,000+ who attended the conference, either in person or virtually. Most walked away feeling better informed and more positive about their prospects. Looking back at our data history, sentiment experienced a similar post-conference pop in previous years. The jump is particularly noticeable compared with sentiment this time last year (see charts) when the economy was still struggling to recover from the effects of the pandemic.
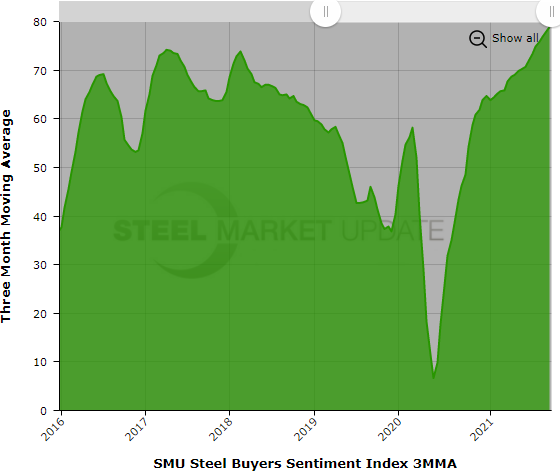
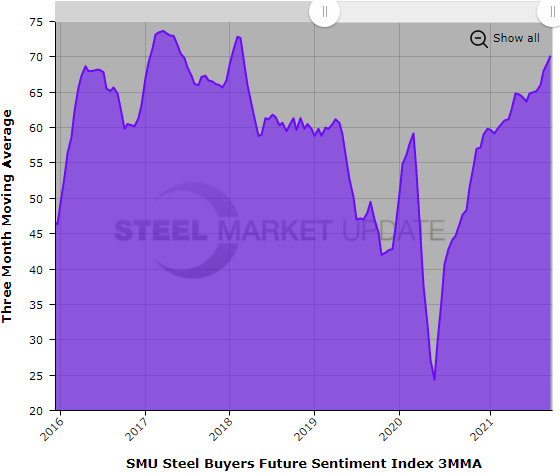
Measured as a three-month moving average (3MMA) to smooth out the variability, Current Sentiment stood at +78.83 this week, the highest on record. The Future Sentiment 3MMA moved up to +70.17, its highest since February 2018.
Don’t read too much into the record set in this week’s survey. Nor into the declines likely to come when the halo effect from the Steel Summit wears off in the weeks ahead. The true message is a simple one: As long as steel prices and profits remain near all-time highs, industry optimism most likely will as well.
What Respondents Had to Say
“We are wrapping up August and it will undoubtedly be the best month in our 60+ year history. And don’t look now, but September ought to be even better.”
“If we are able to rebuild our supply chain with increased imports for 2022, we will have a great year in terms of volumes. Profits will be down as we have just gone through a once in a lifetime spike.”
“Three months ahead, I would say “excellent”; six months ahead, I will temper myself and say “good.” Overall, I’m bullish through the first half of 2022.”
“Business looks good at least through Q1 2022.”
“There’s still a lot of uncertainty: Section 232’s future, price adjustments in 2022, will COVID-19 slow future demand?”
“We expect a lot of headwind, but we should be successful in the near future.”
“We are taking care of current customers. Not able to add new business due to supply and credit issues.”
“We’re worried about longer-term effects from long lead times to customers.”
About the SMU Steel Buyers Sentiment Index
SMU Steel Buyers Sentiment Index is a measurement of the current attitude of buyers and sellers of flat-rolled steel products in North America regarding how they feel about their company’s opportunity for success in today’s market. It is a proprietary product developed by Steel Market Update for the North American steel industry.
Positive readings run from +10 to +100. A positive reading means the meter on the right-hand side of our home page will fall in the green area indicating optimistic sentiment. Negative readings run from -10 to -100. They result in the meter on our homepage trending into the red, indicating pessimistic sentiment. A reading of “0” (+/- 10) indicates a neutral sentiment (or slightly optimistic or pessimistic), which is most likely an indicator of a shift occurring in the marketplace. Sentiment is measured via Steel Market Update surveys that are conducted twice per month. We display the meter on our home page for all to see.
We currently send invitations to participate in our survey to more than 600 North American companies. Our normal response rate is 100-150 companies. Approximately 40 percent are manufacturers, 45 percent are service centers/distributors, and 15 percent are steel mills, trading companies or toll processors involved in the steel business.
Click here to view an interactive graphic of the SMU Steel Buyers Sentiment Index or the SMU Future Steel Buyers Sentiment Index.
By Tim Triplett, Tim@SteelMarketUpdate.com


