

Market Data

September 17, 2021
Shipments and Supply of Steel Products Expand Further in July
Written by David Schollaert
Mill shipments of steel products rose 2.0% in July to 8.7 million tons, following an increase of 1.7% the month prior. Apparent supply jumped 3.6% in July after a 6.0% increase the prior month. July marks the fifth consecutive month of gains after February’s double-digit contraction.
This analysis is based on steel mill shipment data from the American Iron and Steel Institute (AISI) and import-export data from the U.S. Department of Commerce (DOC). The analysis summarizes total steel supply by product from 2008 through July 2021 and year-on-year changes.
Sustained demand and supply limitations have pushed steel prices to record heights over the past 13 months. Steel supplies, including domestic production and imports, have been steadily rising, bringing balance to supply and demand fundamentals. Domestic mill utilization has continued to hover around 85% on average as mills are running near capacity, while imports have been on the rise. As a result, lead times have been edging down and steel price increases have moderated, with many questioning if prices have peaked.
SMU’s benchmark hot-rolled coil price range is $1,900-$2,000 per net ton with an average of $1,950 per ton FOB mill as of Sept. 14. A slight decrease of $10 per ton on the lower end of the range brought the average down $5 per ton, the first decrease since Aug. 11 of last year. Raw steel production shown below in Figure 1 is based on weekly data from the AISI displayed as four-week moving averages.
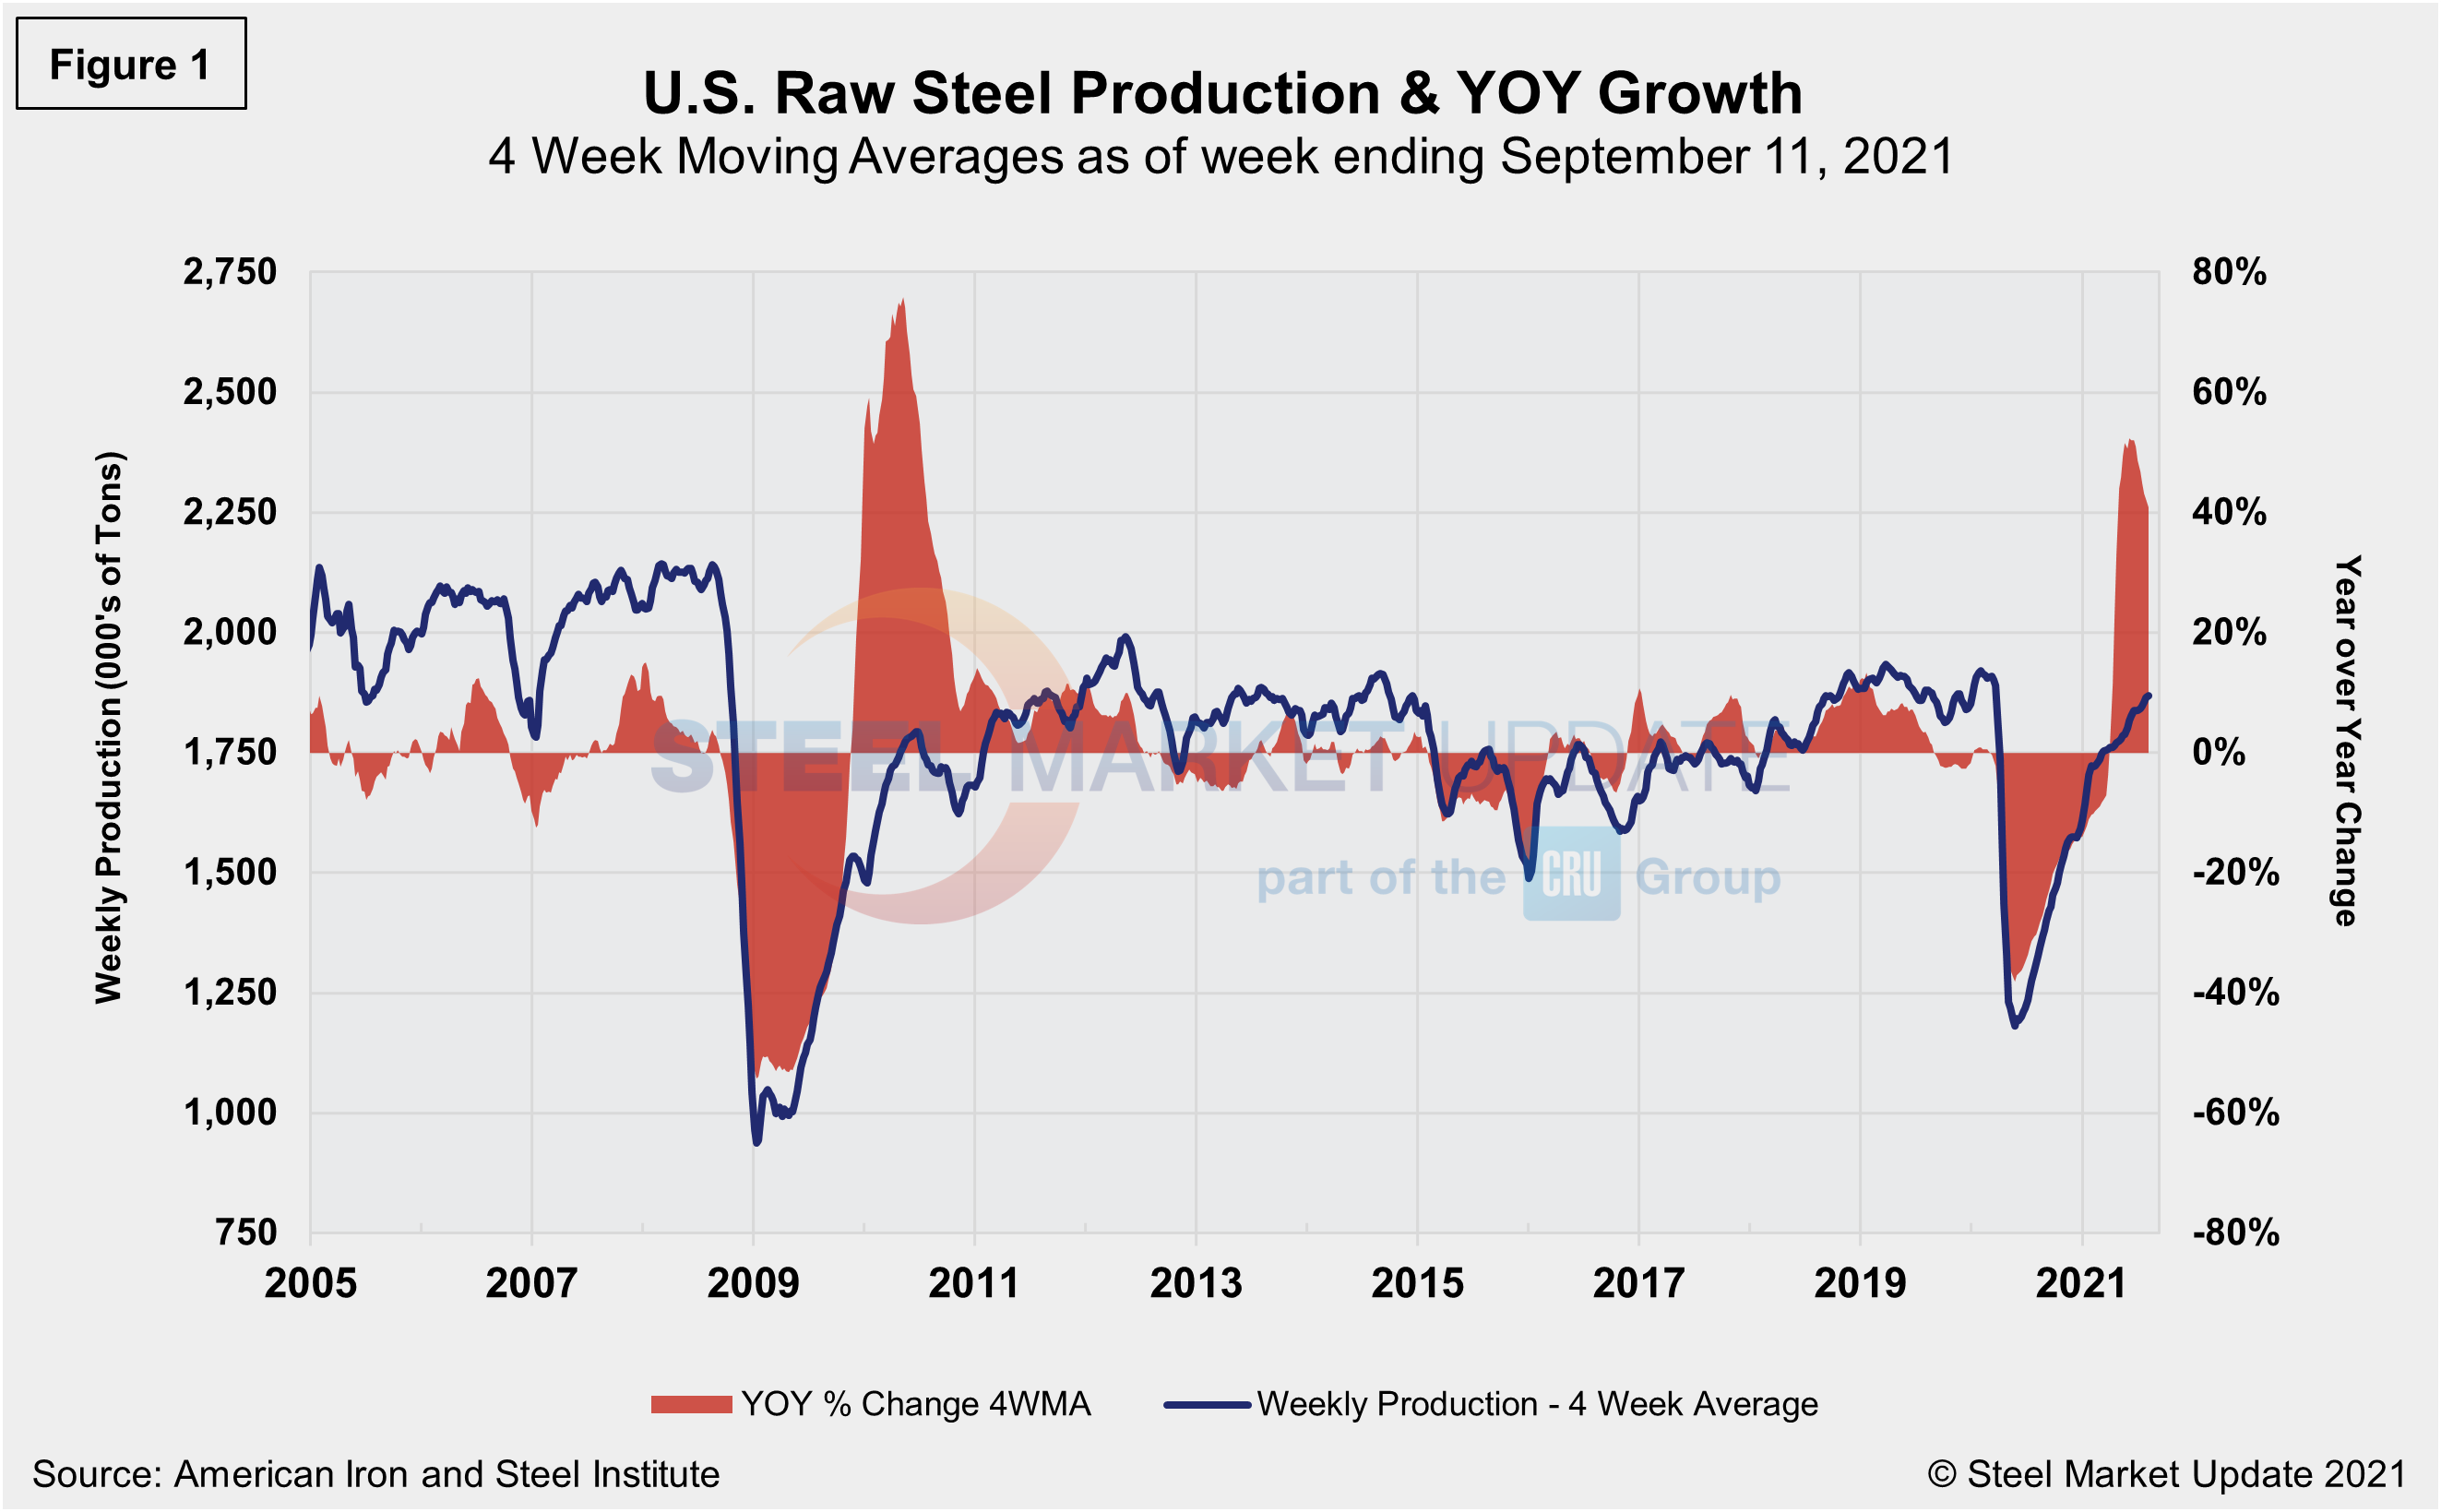
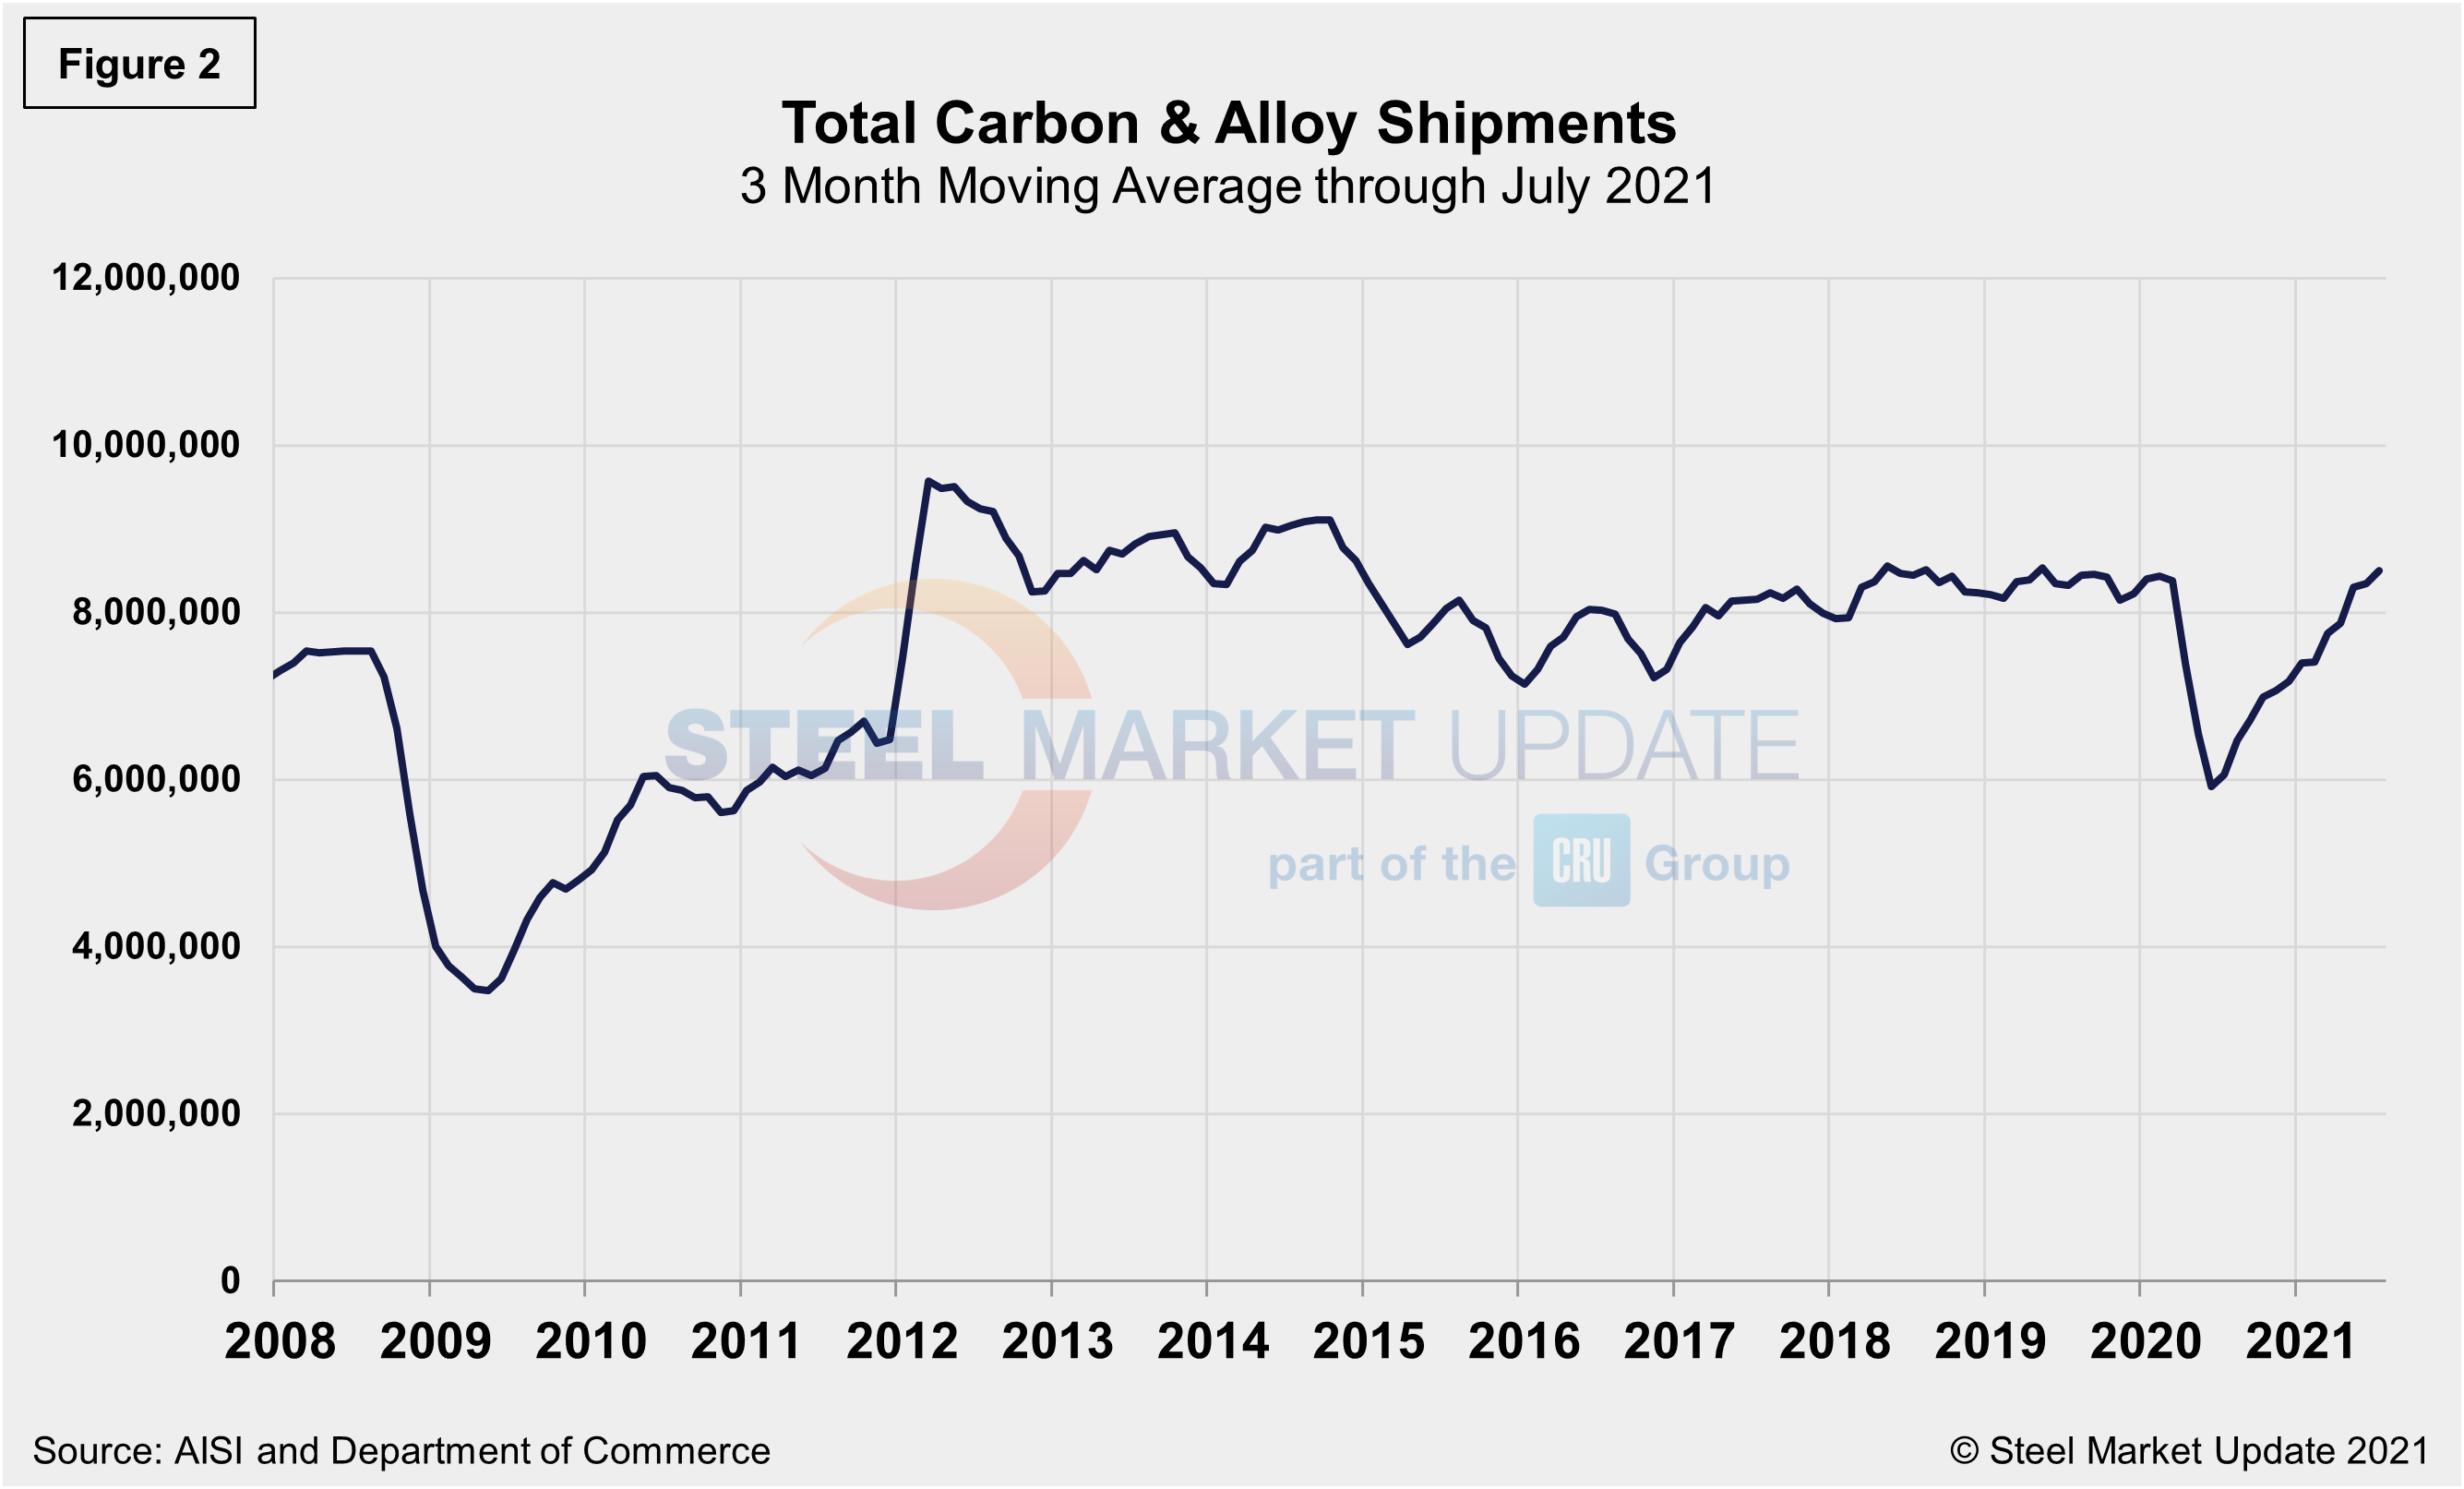
Monthly shipment data for all rolled steel products is noted in Figure 2. The trajectories of the rebounds since Q2 2020 are comparable in Figures 1 and 2. Measured as a three-month moving average (3MMA) of the monthly data, July’s total was 8.714 million tons, compared to 8.542 million tons in June, an increase of 2.0%. Shipments were up 37.2% in July compared to the year prior when shipments were 6.351 million tons. The recovery from the debilitating COVID-driven blows has been significant, as current shipments are up 2.6% from the same pre-pandemic period in 2019.
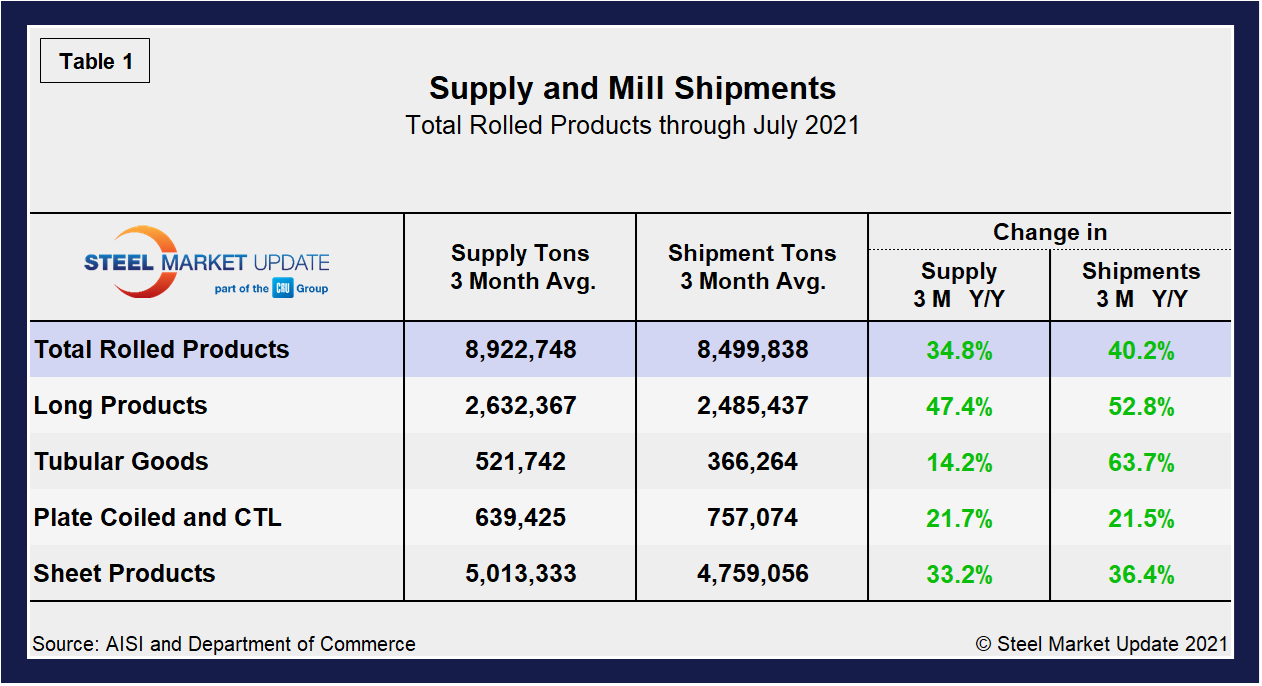
Shipment and supply details for all product groups are noted in Table 1, followed by individual sheet products in Table 2, and domestic supply (shipments and imports) in Table 3. Total supply (proxy for market demand) as a 3MMA was up 34.8% year over year in June, a big turnaround from the 26.0% decline last July when the market had just hit bottom. Apparent supply is defined as domestic mill shipments to domestic locations plus imports. Mill shipments were 40.2% in July, down slightly from 40.9% in June in the three-month comparison. The recovery has varied significantly among various products but should continue to trend up as foreign material and domestic production continue to rise.
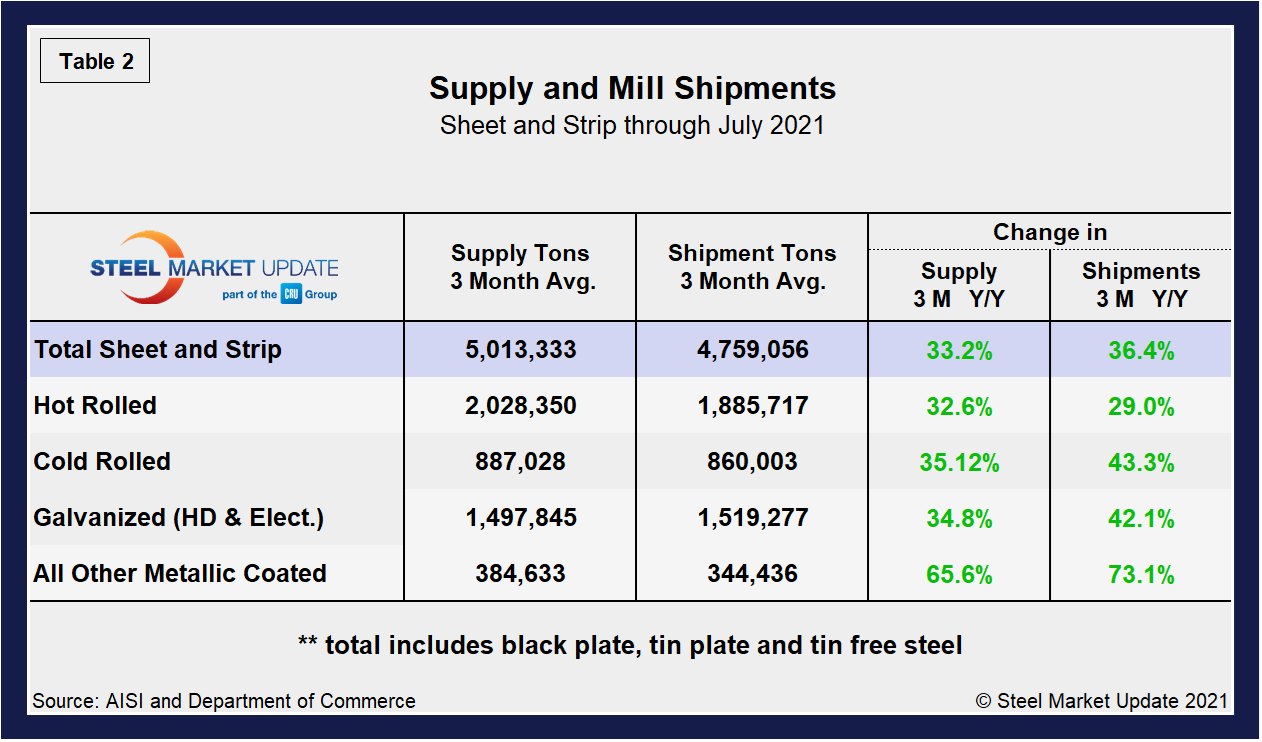
Overall sheet product shipments and supply (Table 2) have improved markedly month on month. Supply increased by 33.2% and shipments by 36.4% in July, a strong recovery from declines of 7.5% and 6.5% just this past March. In the three months through July 2021, the average monthly supply of sheet and strip was 5.013 million tons, up from 4.870 million tons or 2.9% above the prior month. Total sheet and strip apparent supply is up 13.4% year to date (Table 3) compared to 2020. Note that year-over-year comparisons have seasonality removed.
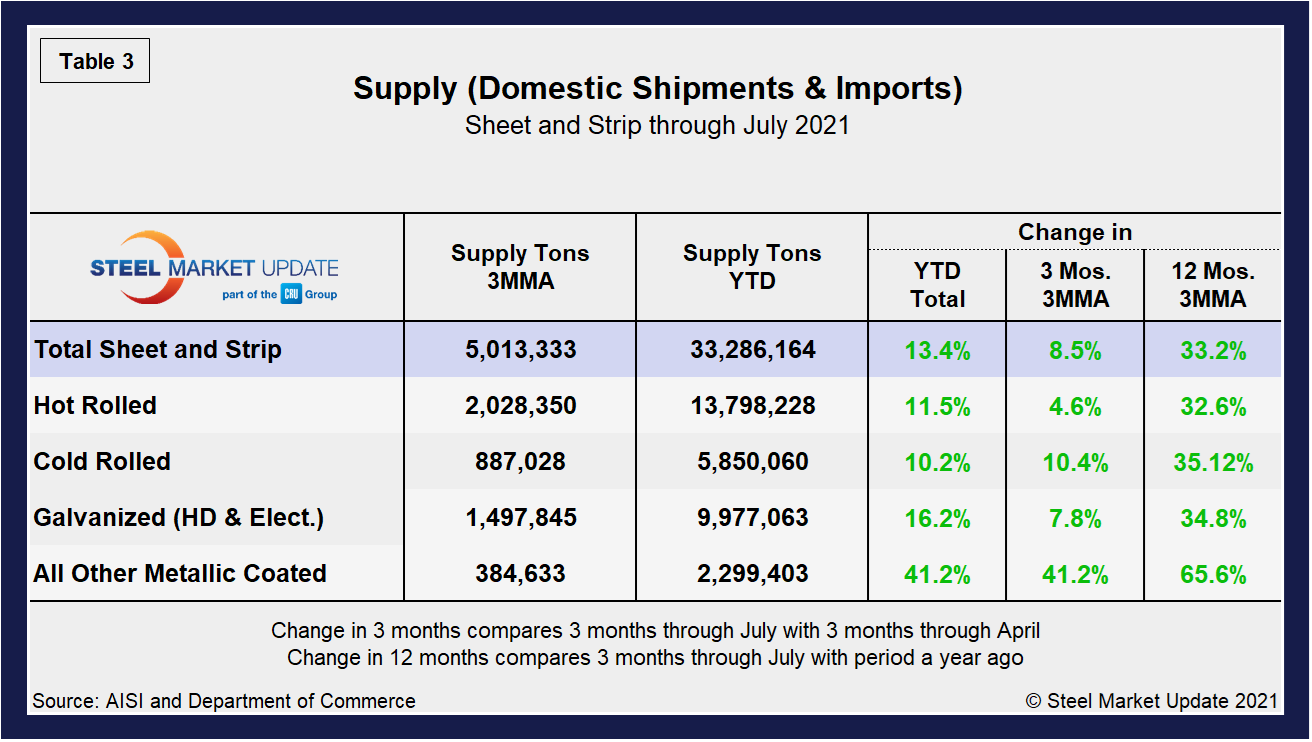
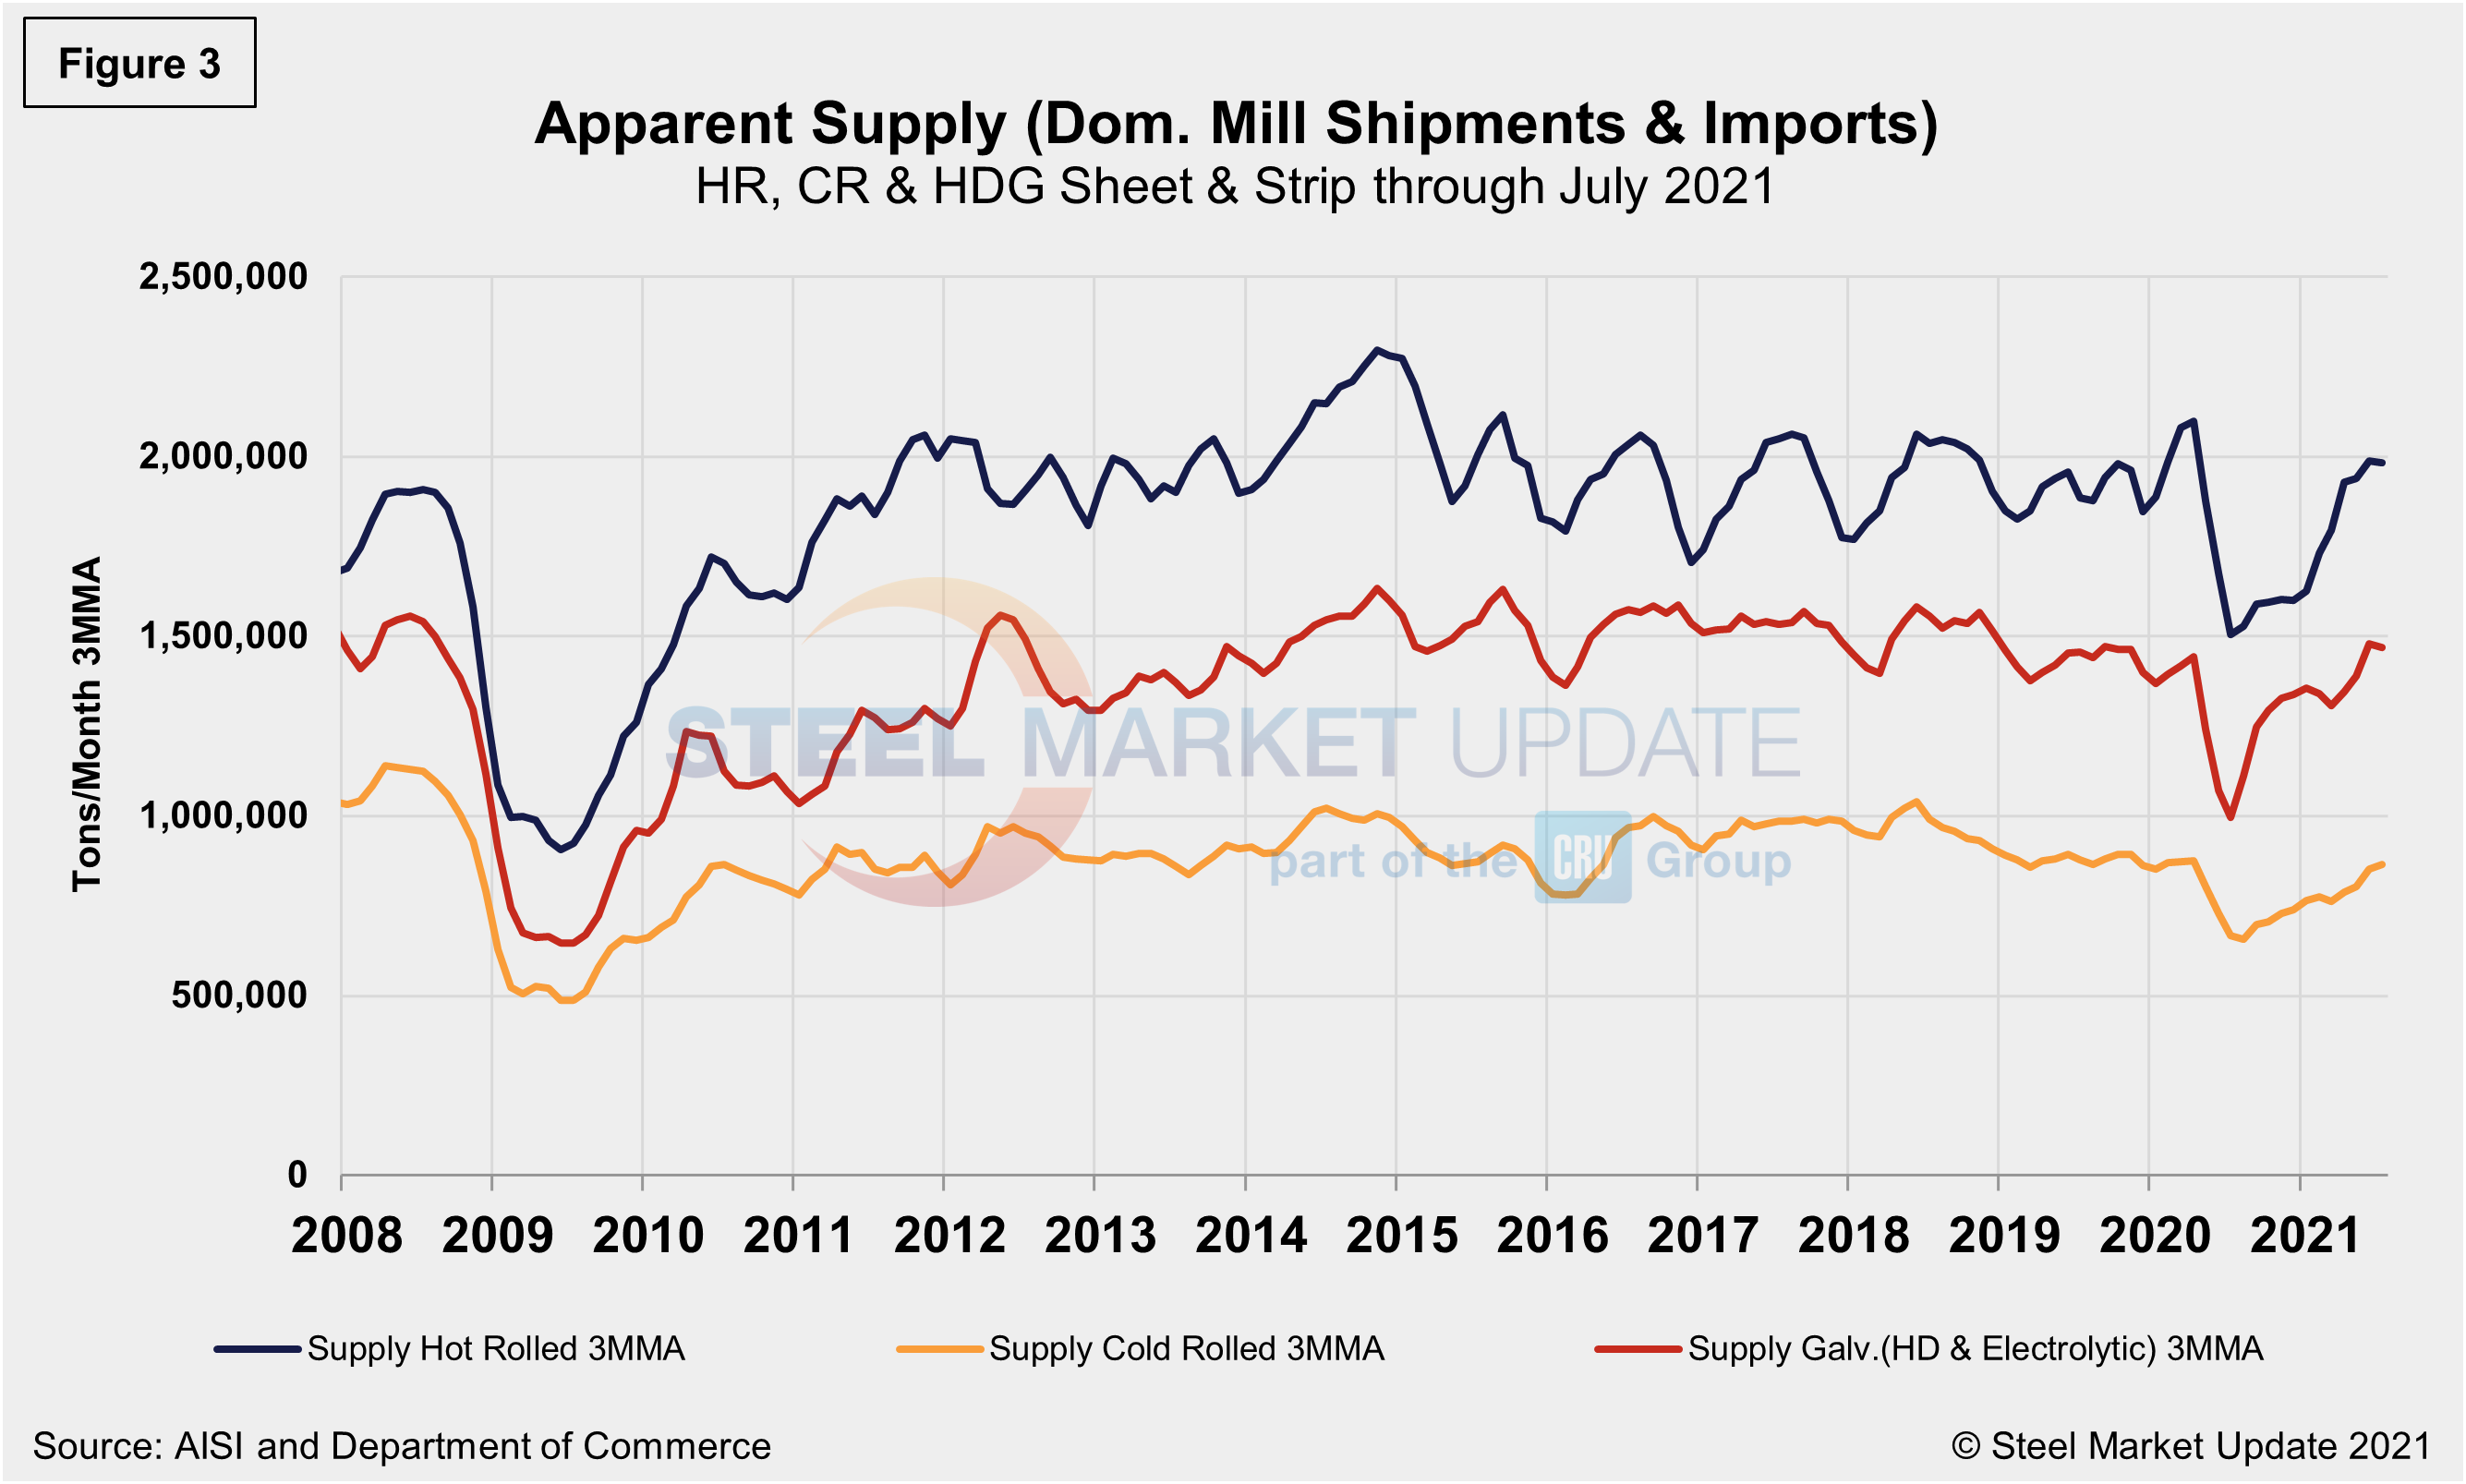
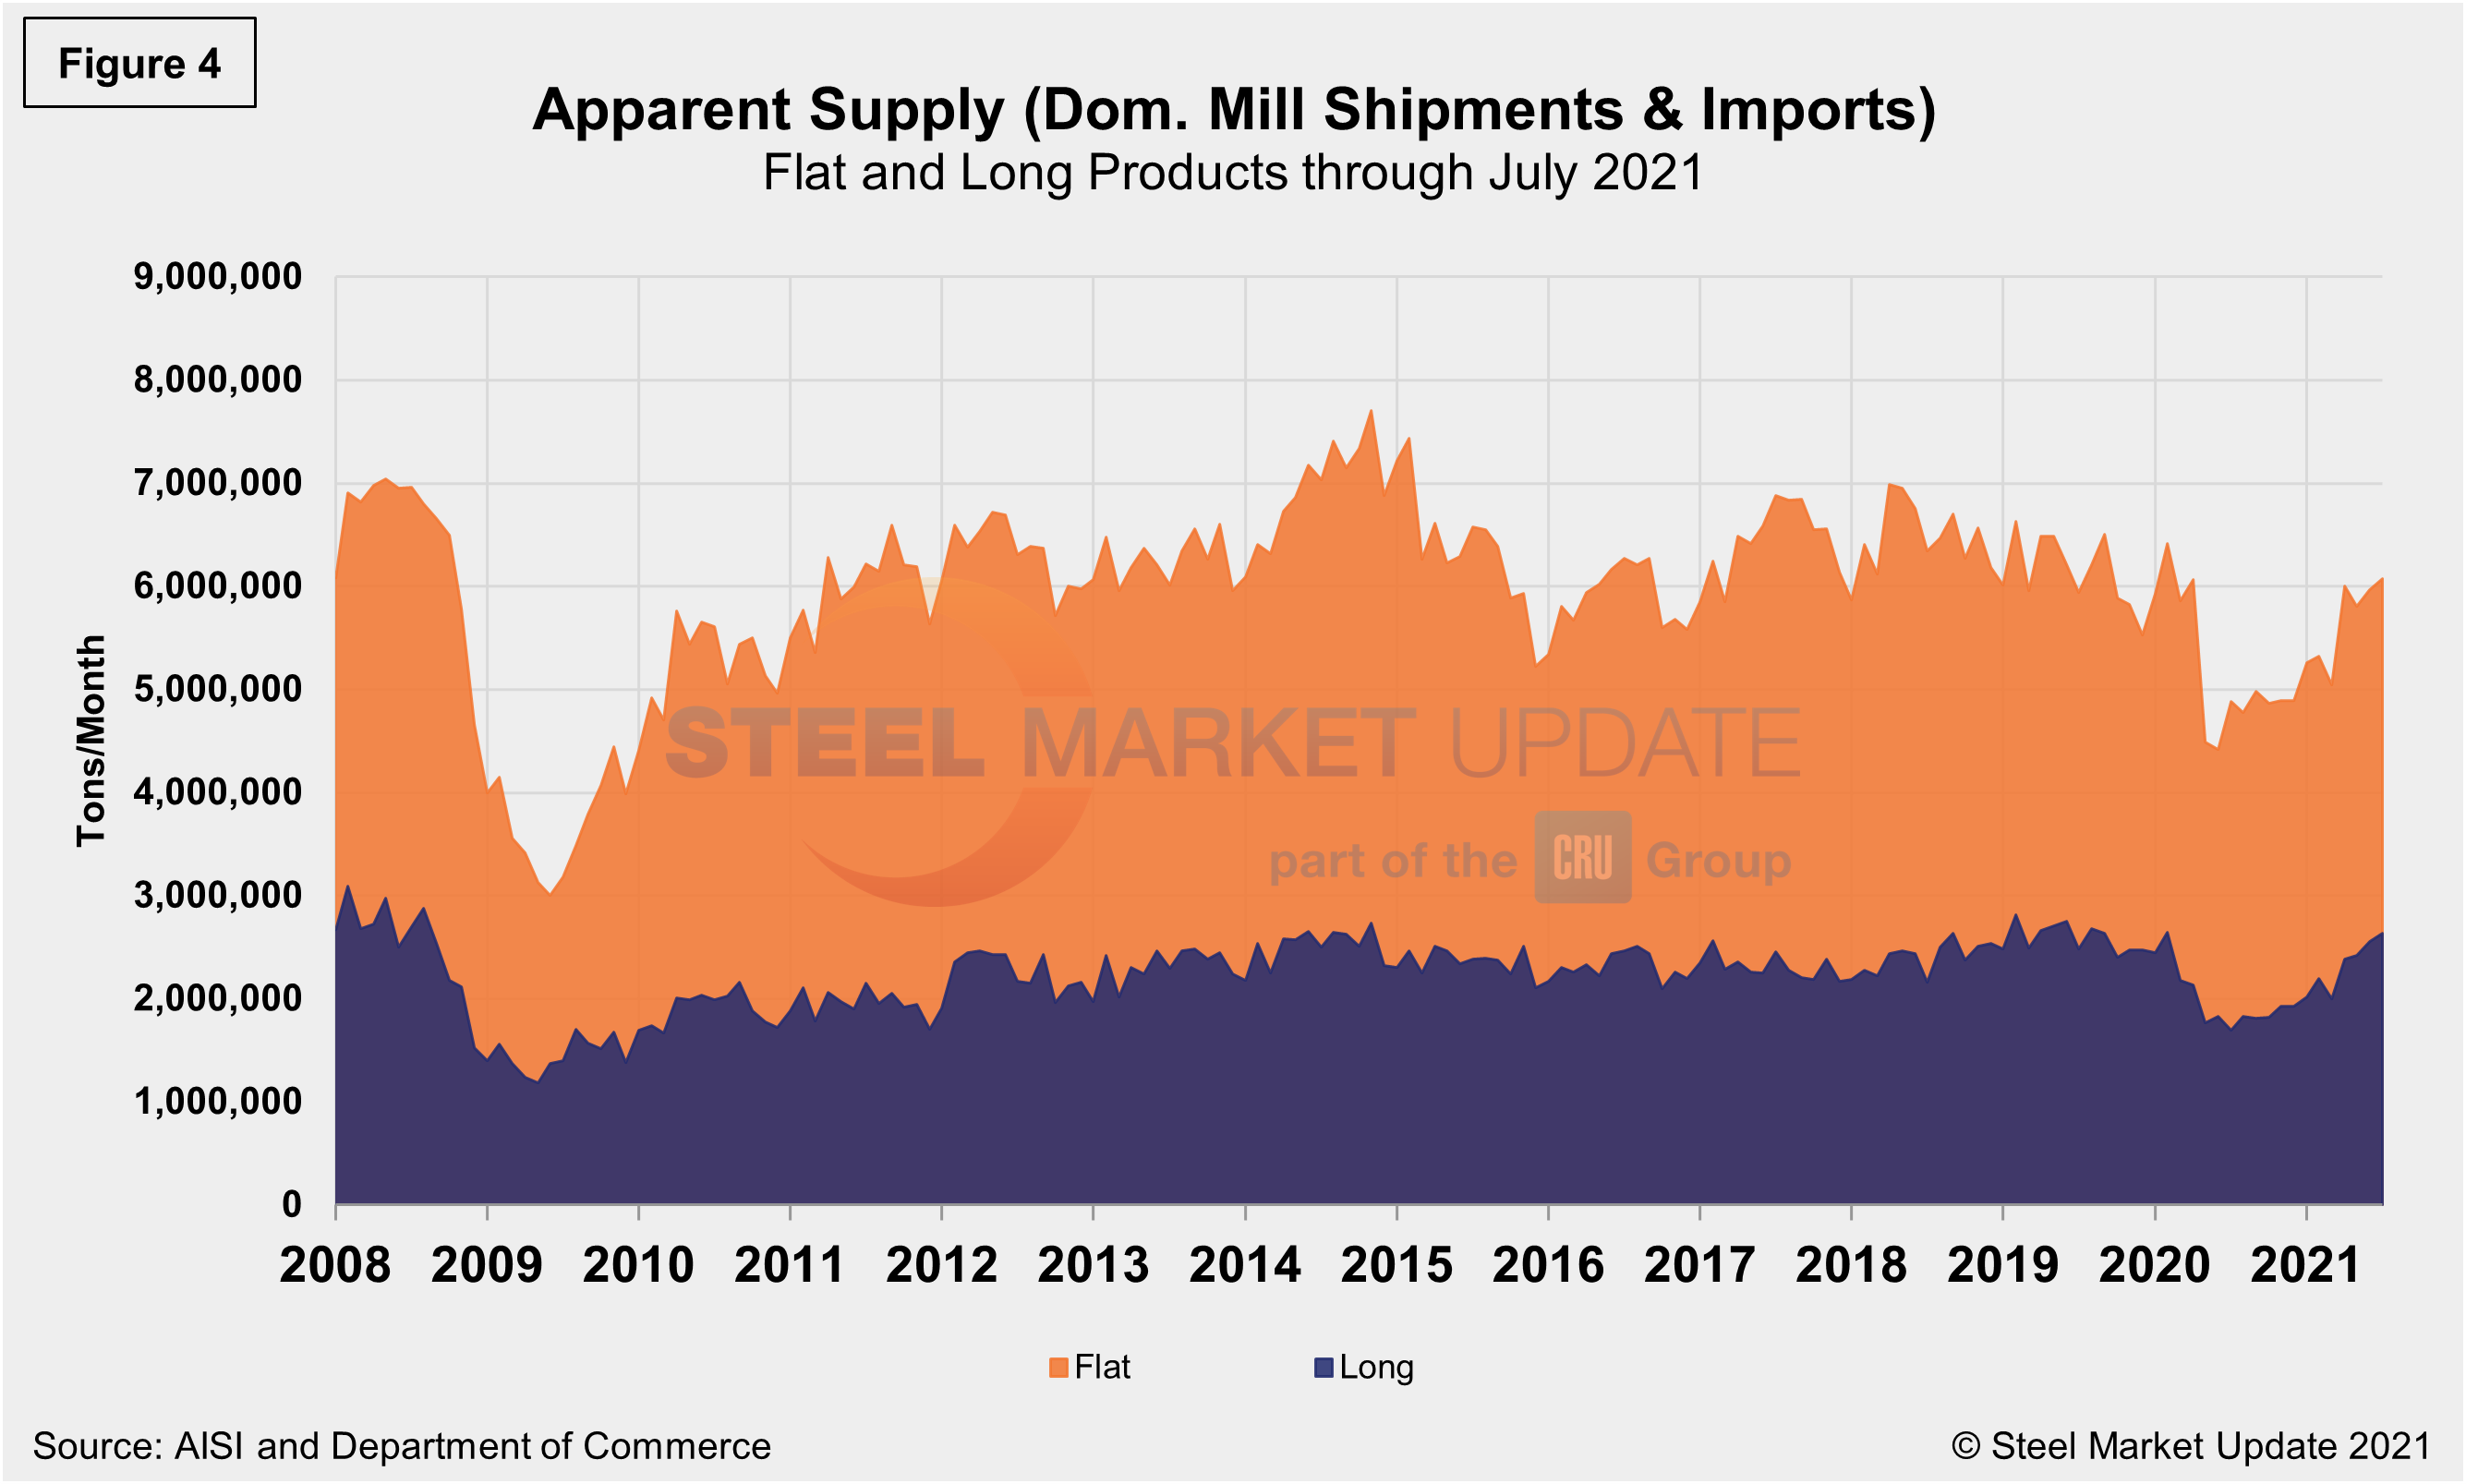
The supply picture for HRC, CRC and HDG since August 2008 as three-month moving averages in Figure 3 and Figure 4 show the long-term comparison between flat and long products. All three sheet products have experienced some improvement since mid-2020, but galvanized (hot dipped and electrolytic) has seen the strongest rebound, a 50.2% jump since reaching bottom in June 2020, and up 1.9% month on month in July. When compared to the same pre-pandemic period in 2019, the supplies of all three products are presently higher; hot rolled coil at an 8.0% increase is the highest. In Figure 4, note that these are monthly numbers (not 3MMAs), which show the trend difference between longs and flat products including plate.
By David Schollaert, David@SteelMarketUpdate.com


