

Market Data

September 29, 2021
Global Steel Production Contracts Again in August
Written by David Schollaert
World crude steel production contracted for the third consecutive month in August, a complete reversal from the repeated months of record-breaking output from March through May, according to World Steel Association (worldsteel) data. Global production in August, at an estimated 156.8 million metric tons, declined 3.0% from July, and was 1.4% lower than the same period last year.
Since peaking at 174.4 million metric tons in May, world crude steel production has trended down, reaching its lowest level since February. August’s total is 17.5 million metric tons lower than May’s high and 4.9 million metric tons below July’s total. Total global output in August was greatly affected by a 4.1% decrease in Chinese production, along with smaller decreases in four of the top 10 steel-producing countries, reported worldsteel.
Year-to-date, world crude steel production totaled 1.312 billion metric tons, up by 10.4% compared with the same period in 2020. Production was also up 5.8% when compared to the same pre-pandemic period in 2019.
The U.S. remained the fourth largest crude steel producer in the world in July, accounting for 7.5 million metric tons or 4.8% of the global total. U.S. production in August was unchanged when compared to the prior month. Compared with the same month last year when the economy was struggling with COVID disruptions, August’s production was an improvement of 26.5%, and up 1.4% compared to the pre-pandemic period in 2019.
U.S. production through the first eight months of 2021 totaled 56.5 million metric tons, 18.1% higher than the same period one year ago but still 4.4% behind pre-pandemic levels from 2019.
China continued to produce more than half of the world’s steel at 53.1% or an estimated 83.2 million metric tons in August. Chinese production was down 4.1% from the prior month and accounted for nearly three-fourths of the global decline in August. China’s steel production was down 12.3% when compared with August 2020.
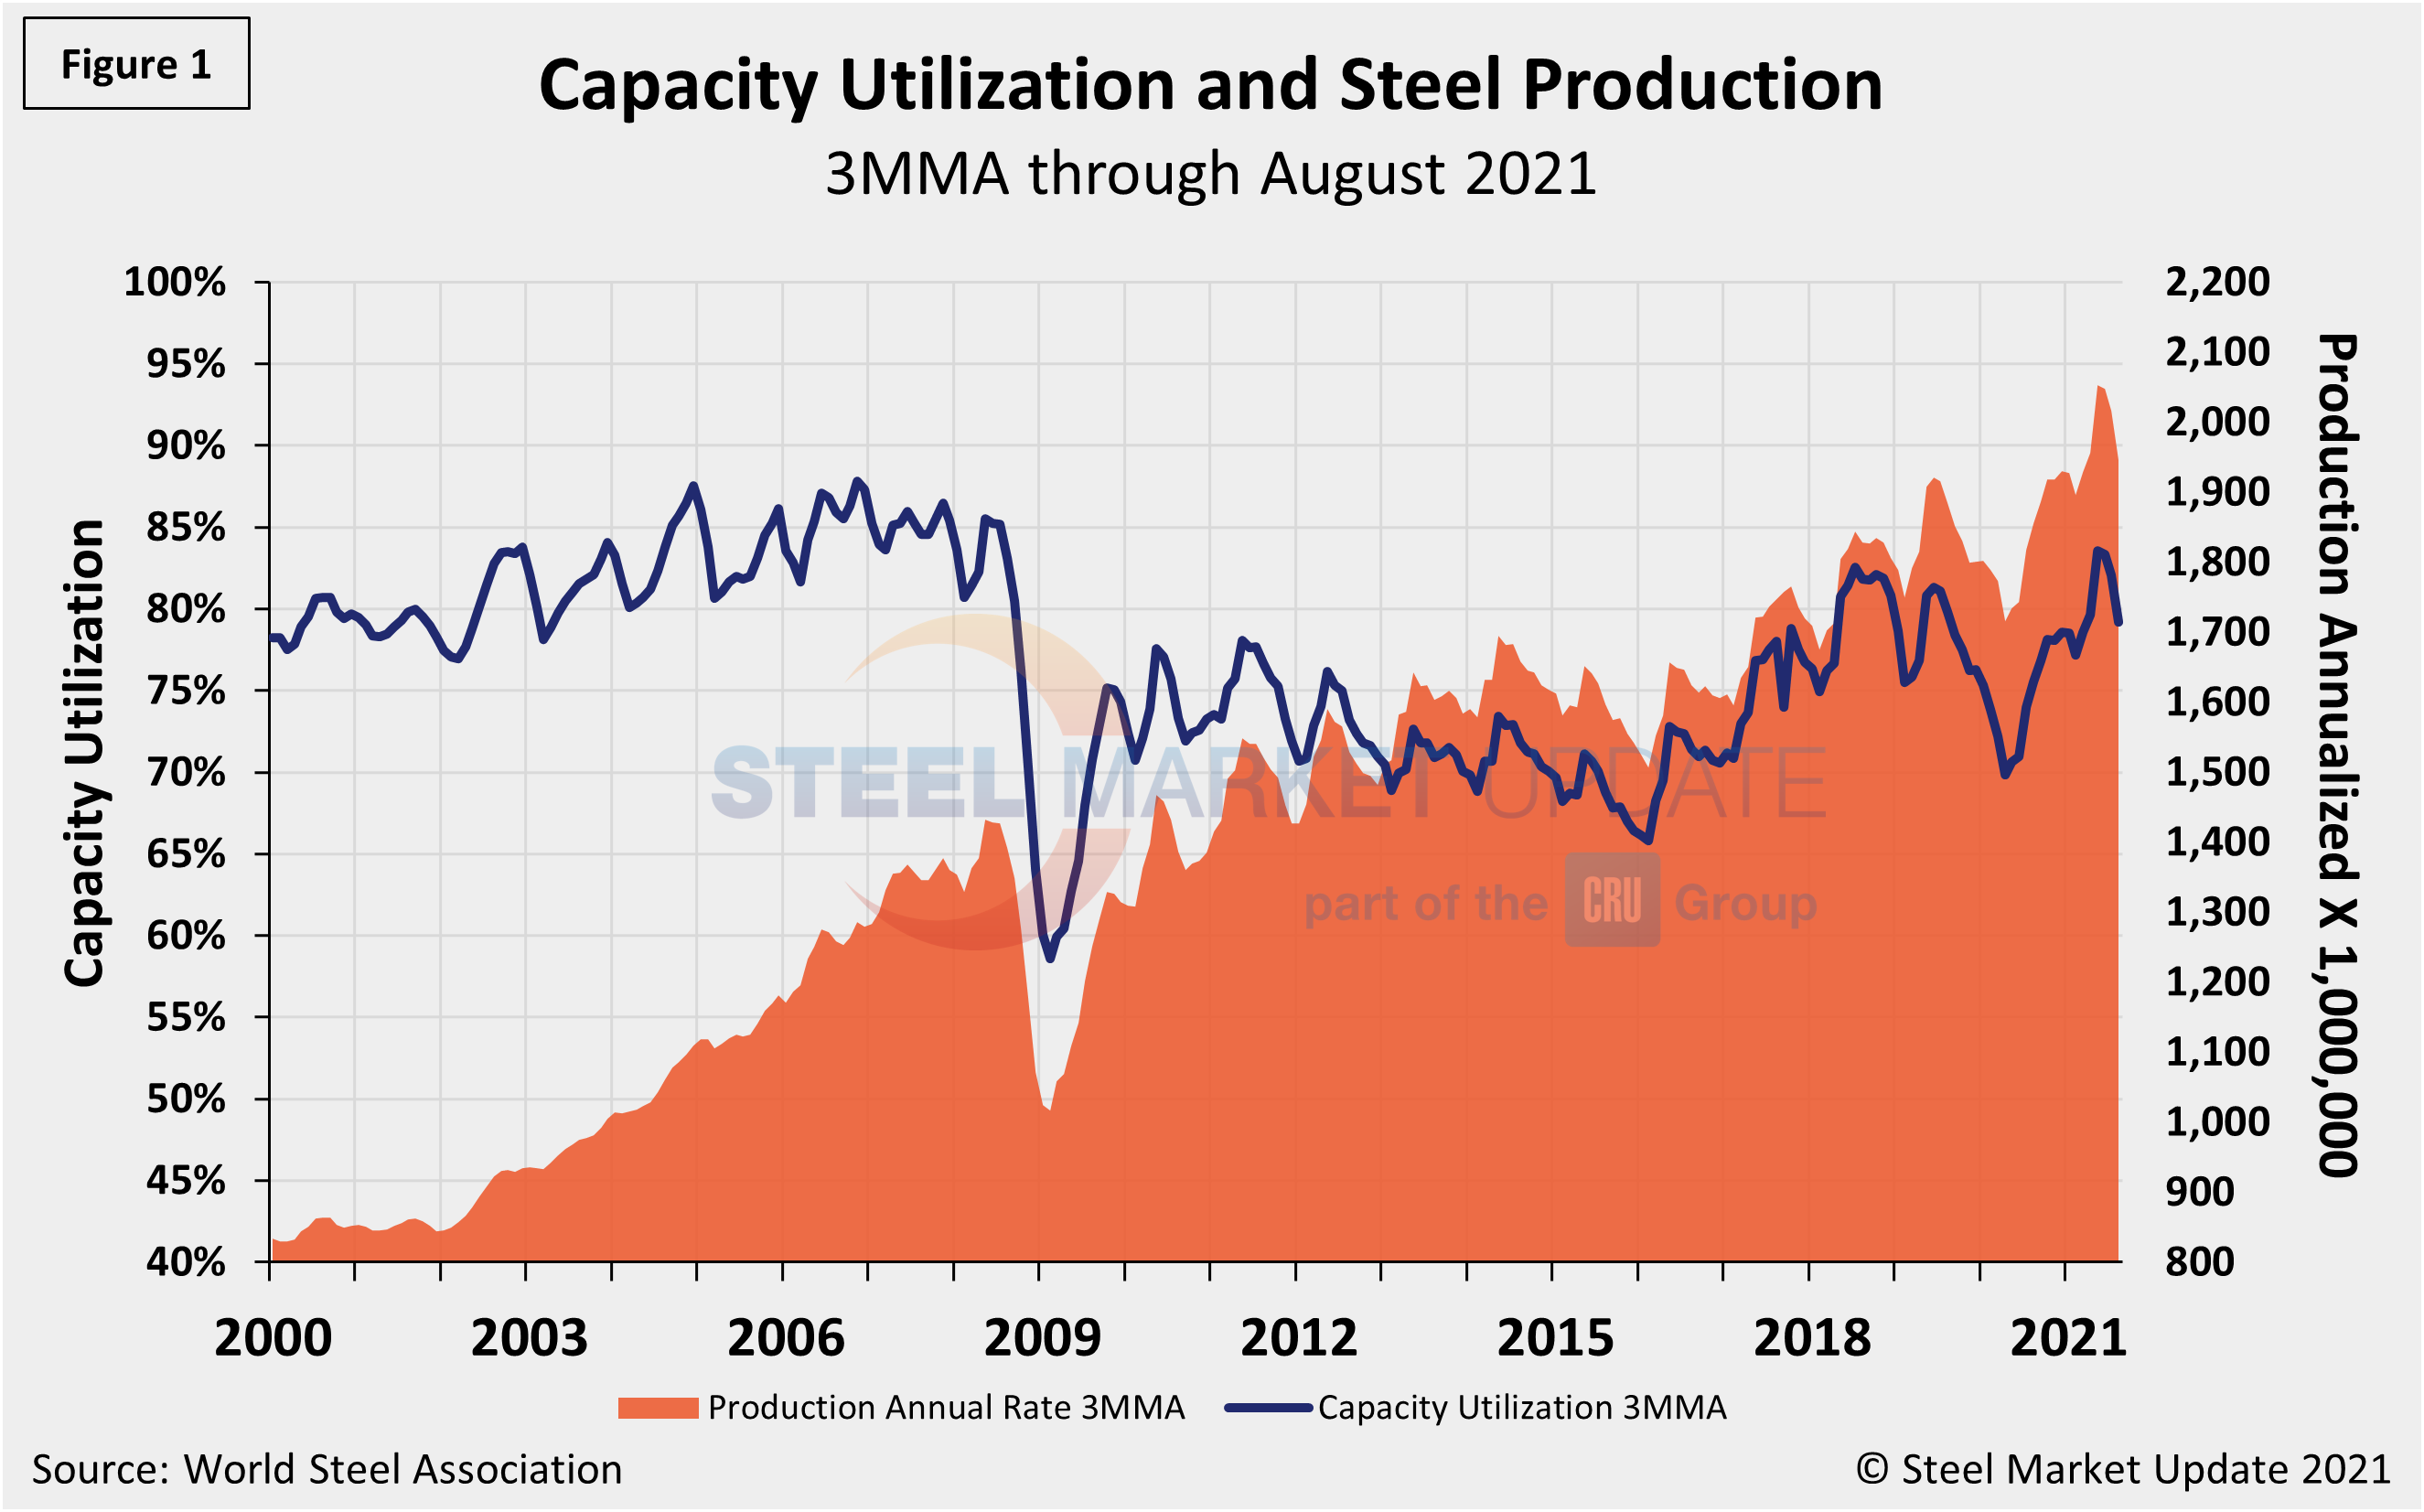
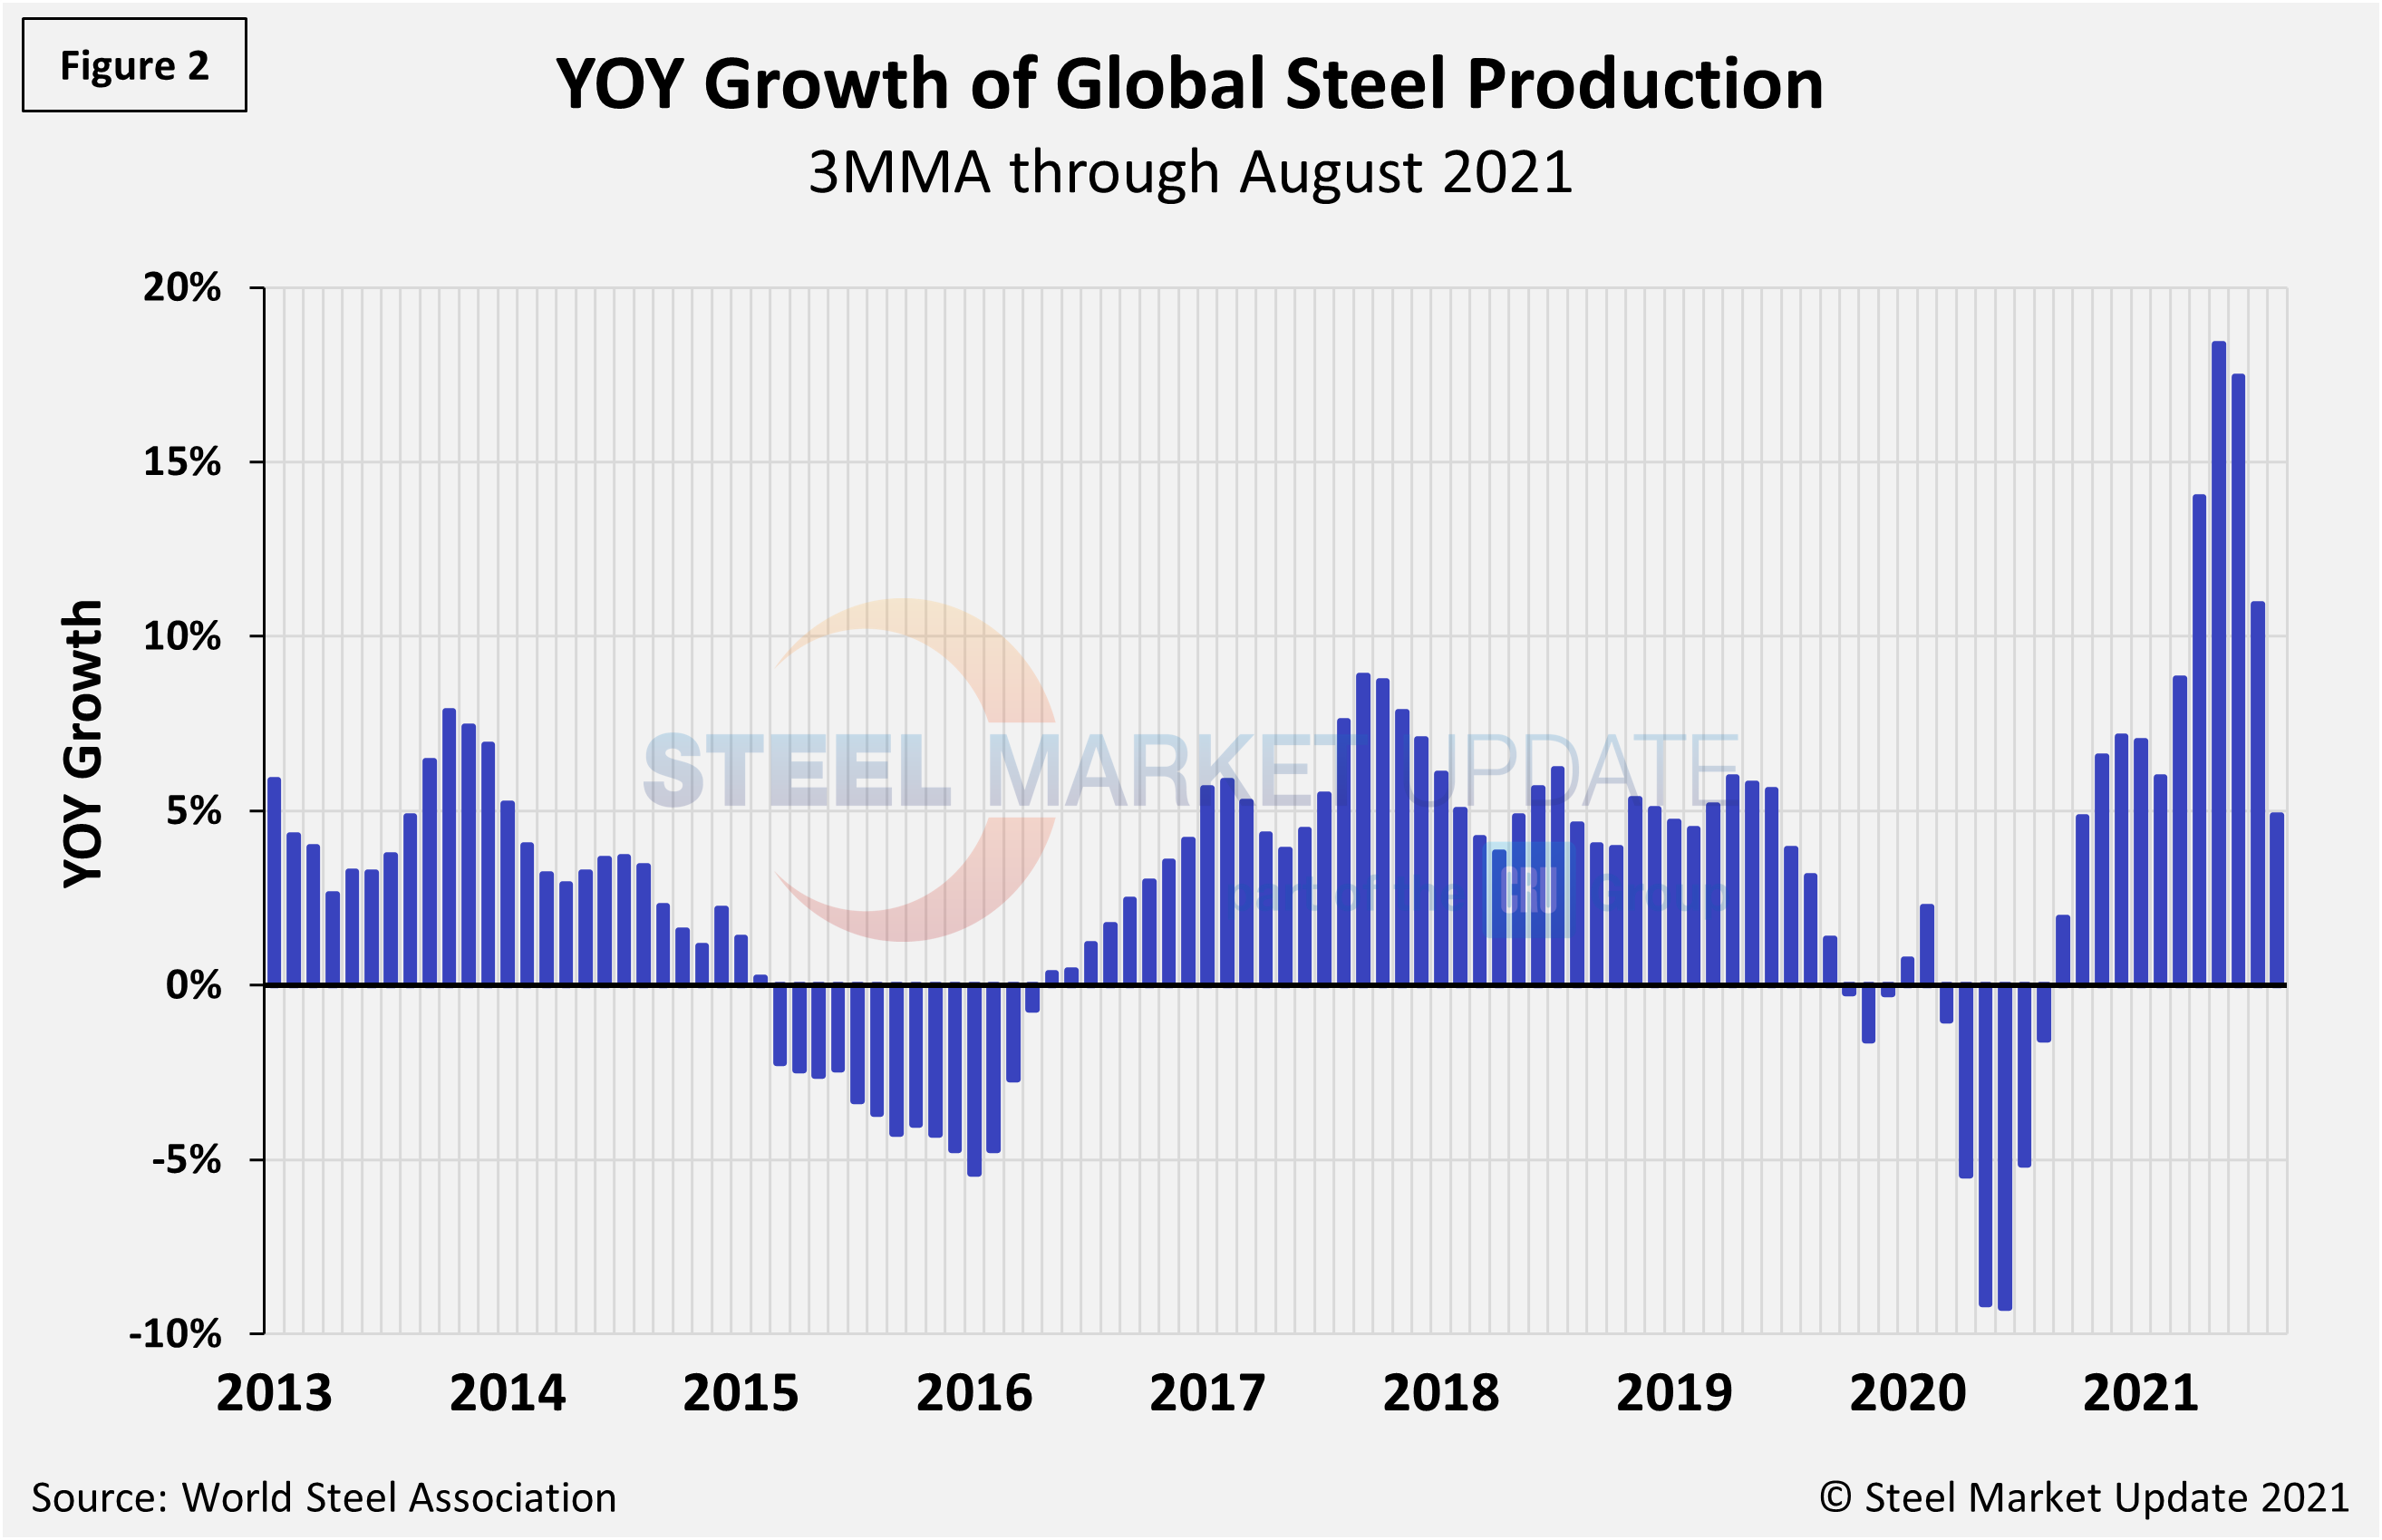
Shown below in Figure 1 is the annualized monthly global steel production on a three-month moving average (3MMA) basis and capacity utilization since January 2000 based on data from worldsteel, while Figure 2 shows the year-over-year growth rate of global production on the same 3MMA basis since January 2013. Capacity utilization in August on a 3MMA basis was 79.2%, down 2.9 percentage points from the month prior. On a tons-per-day basis, production in August was 5.058 million metric tons, down for the third straight month following May’s record rate of 5.813 million metric tons. Growth on a three-month moving average through August on a year-over-year basis was 4.9%, a steep fall from 10.9% the month prior.
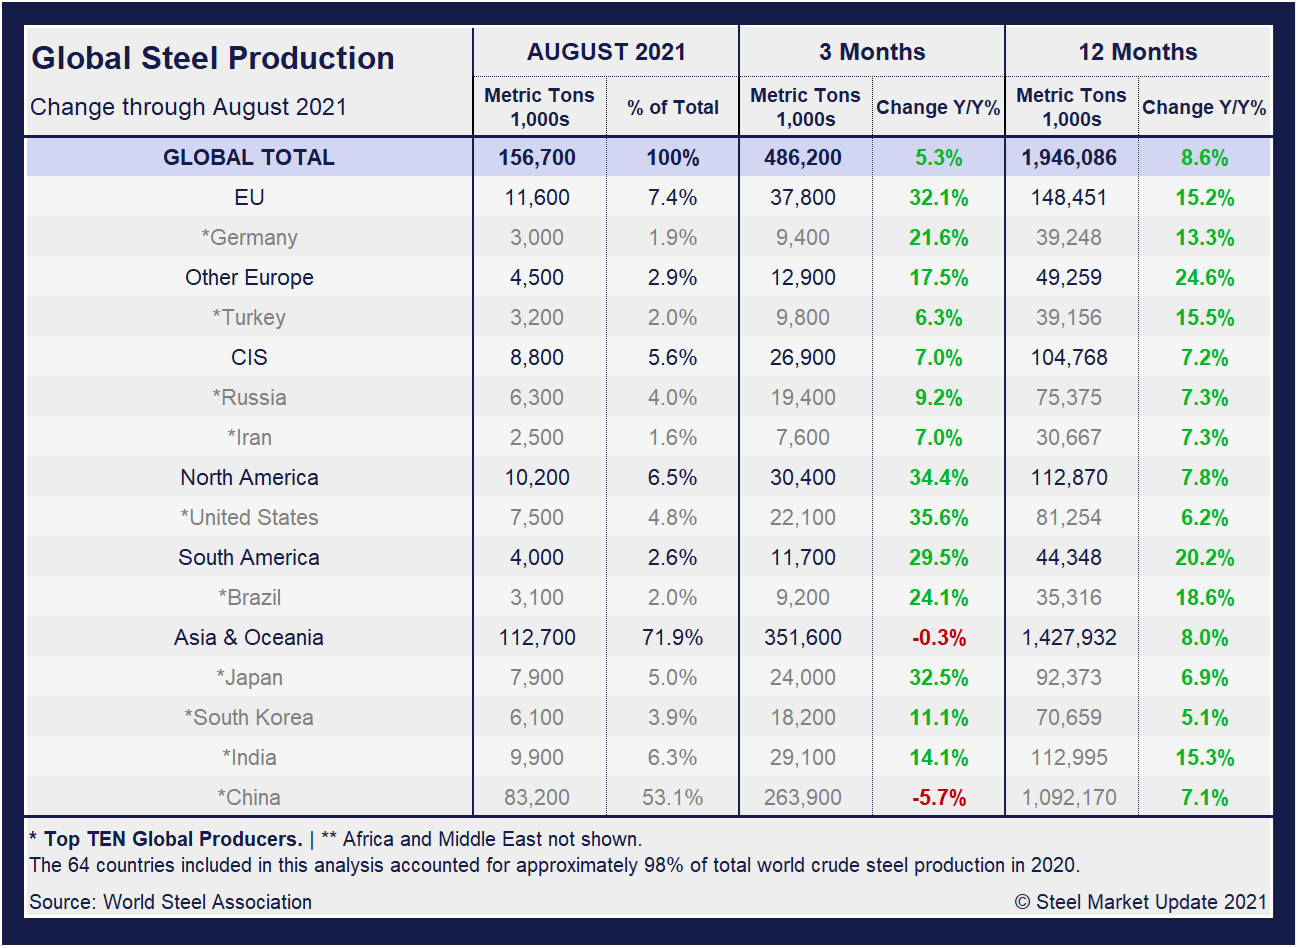
Displayed in the table below is global production broken down into regions, the production of the top 10 nations in the single month of August, and their share of the global total. It also shows the latest three months and 12 months of production through August with year-over-year growth rates for each period. Regions are shown in black font and individual nations in gray. World steel production overall grew 5.3% in three months, but saw a significant deceleration from the 17.9% growth just two months prior. Over 12 months through August, though, growth was 8.6%, up 0.7 percentage points from the same period in June. The market has not maintained positive momentum, as the three-month growth rate is now lower than the 12-month growth rate.
The table shows that North American production was up 34.4% in the three months through August, but up just 7.8% year on year. The positive momentum in the North American market is significant as the economy continues to recover from the pandemic. More importantly, when compared to the same pre-pandemic period in 2019, present output is up 1.6%.
China’s Crude Steel Production
China’s monthly steel production was estimated at 83.2 million metric tons in August, down from 86.8 million metric tons the month prior. The 3.6-million-metric-ton month-on-month decrease marks the third consecutive decline following repeated record-breaking months of crude steel output, reaching an all-time high of 99.5 million metric tons in May.
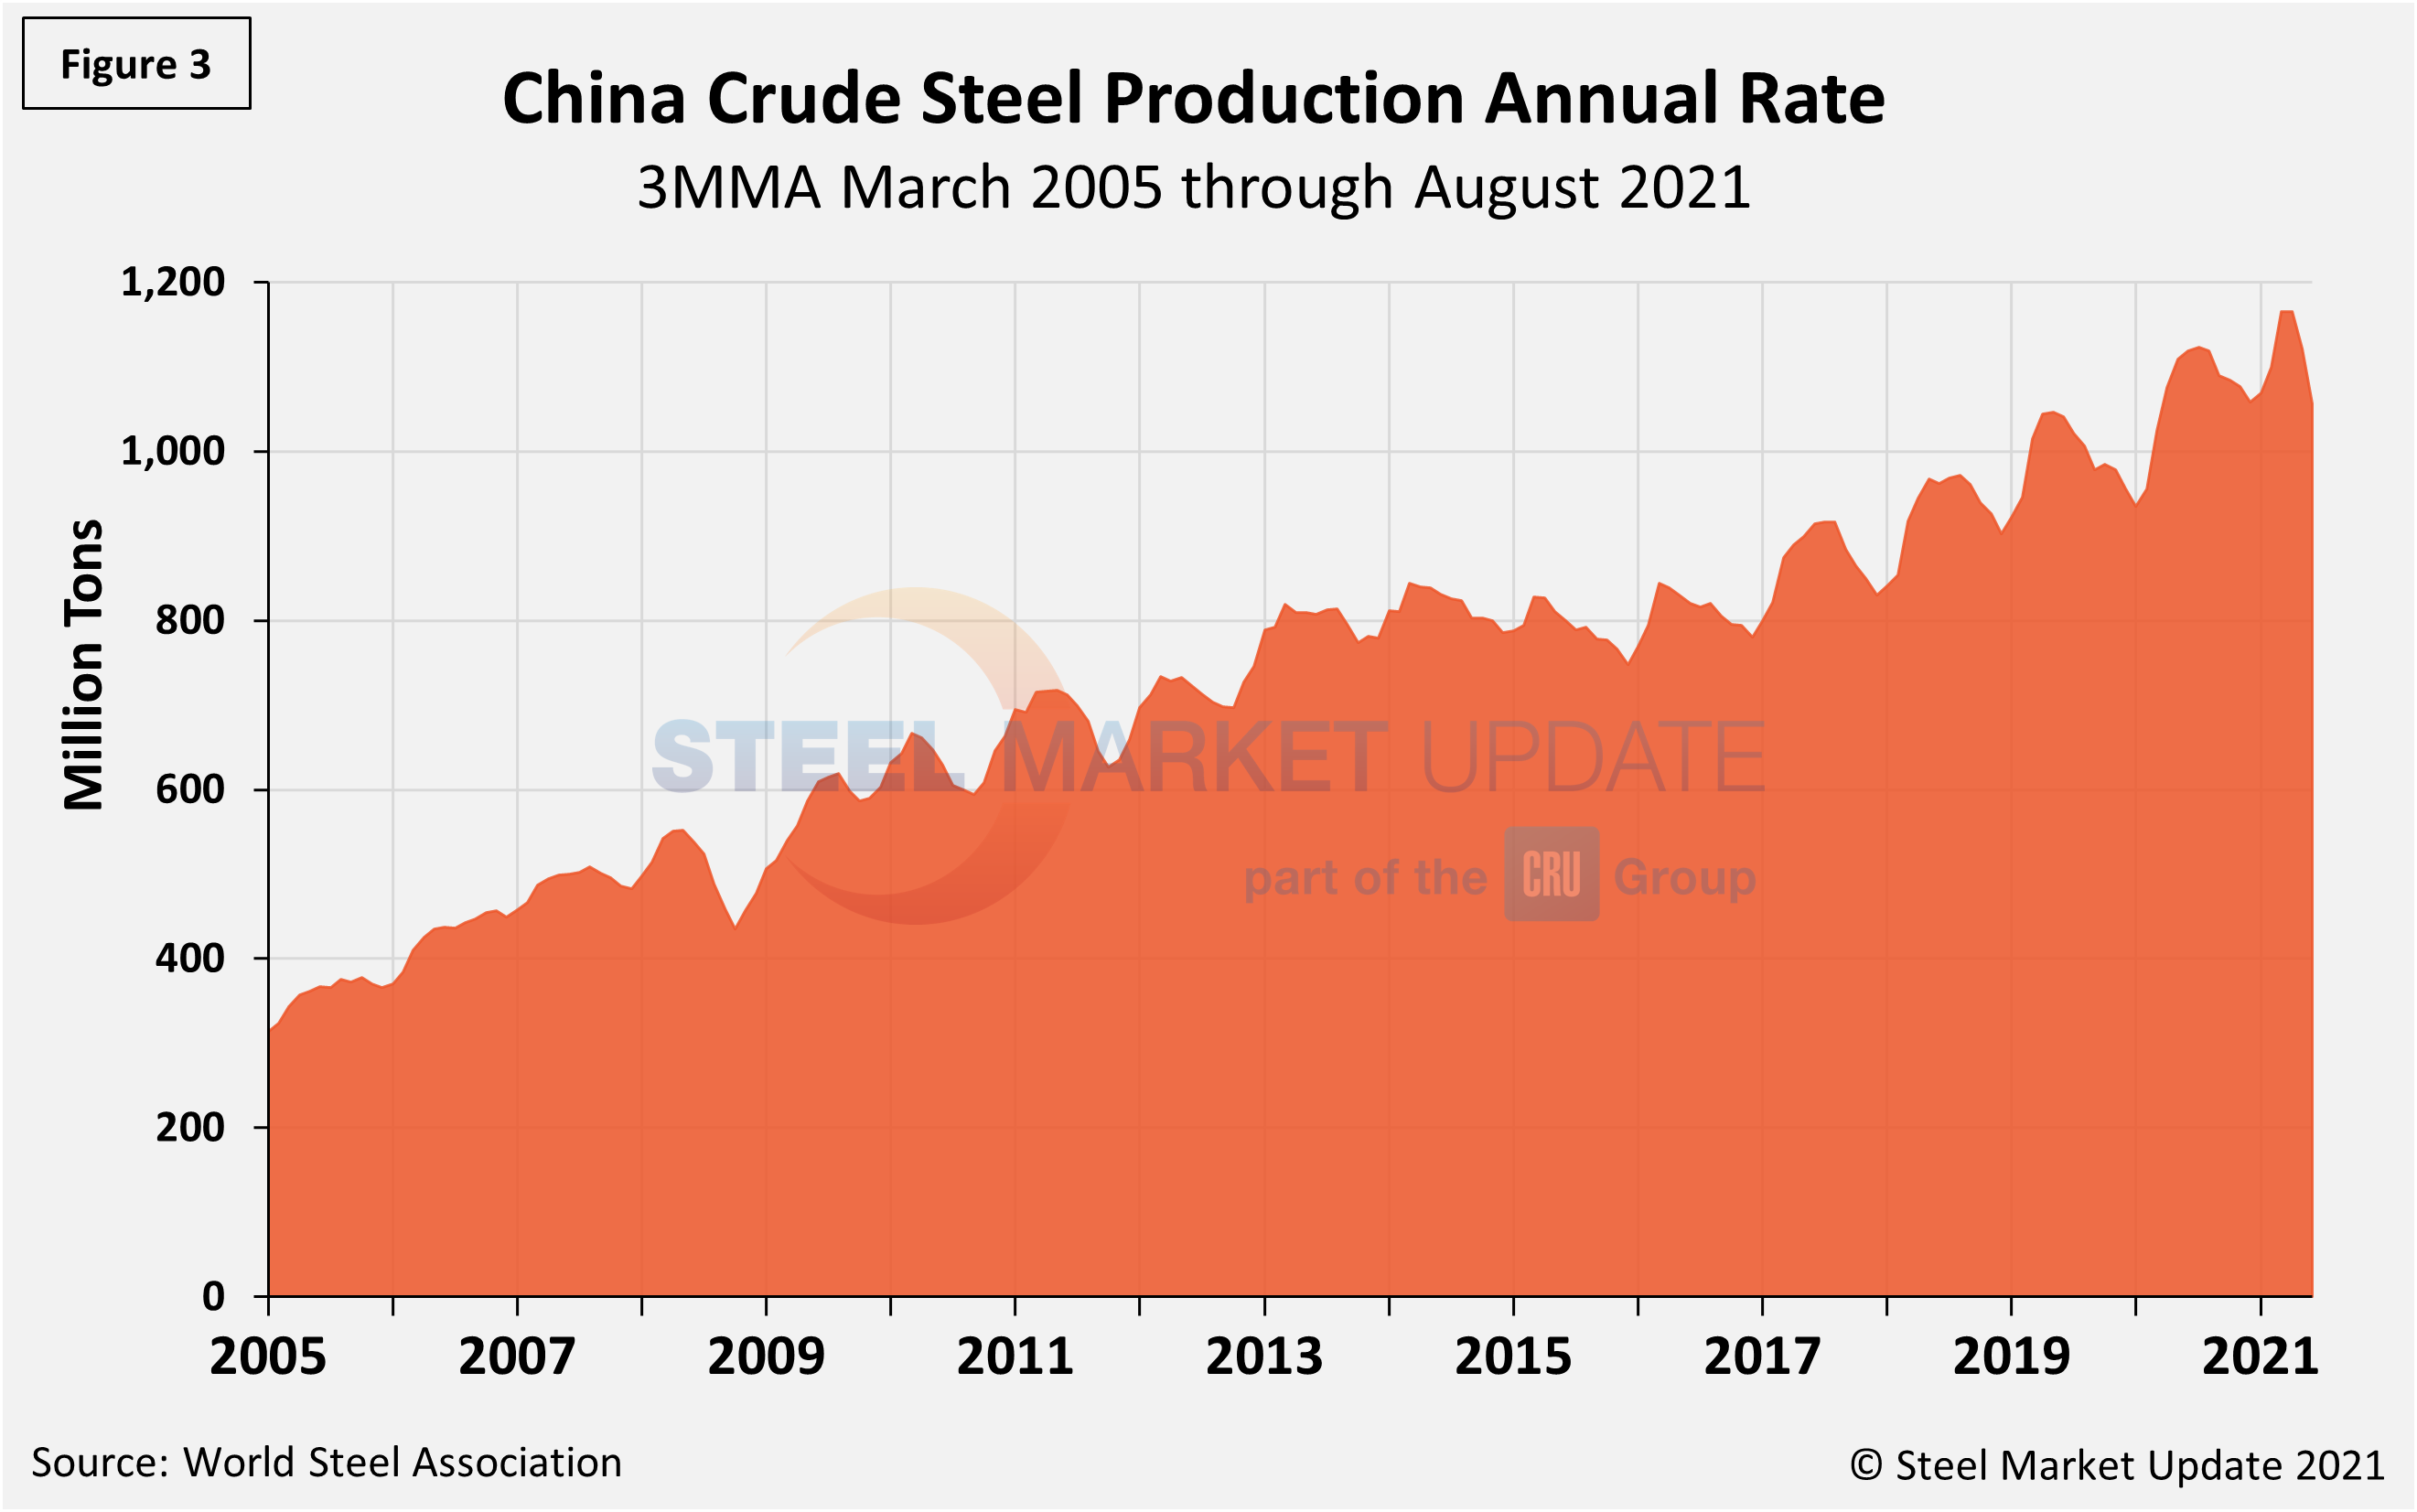
On a 3MMA basis (Figure 3), the annual rate of China’s crude steel production had maxed out at 1.123 billion metric tons in September 2020, then dipped month on month through February. March through May were the first increases since last September, setting a new high of 1.166 billon metric tons in May. August’s total edged down to 1.056 billion metric tons, slipping again, for the third time in as many months. China’s annual capacity is presently 1.128 billion metric tons, and its annual capacity utilization slipped to 96.8% in August, down from its all-time high of 98.4% in June.
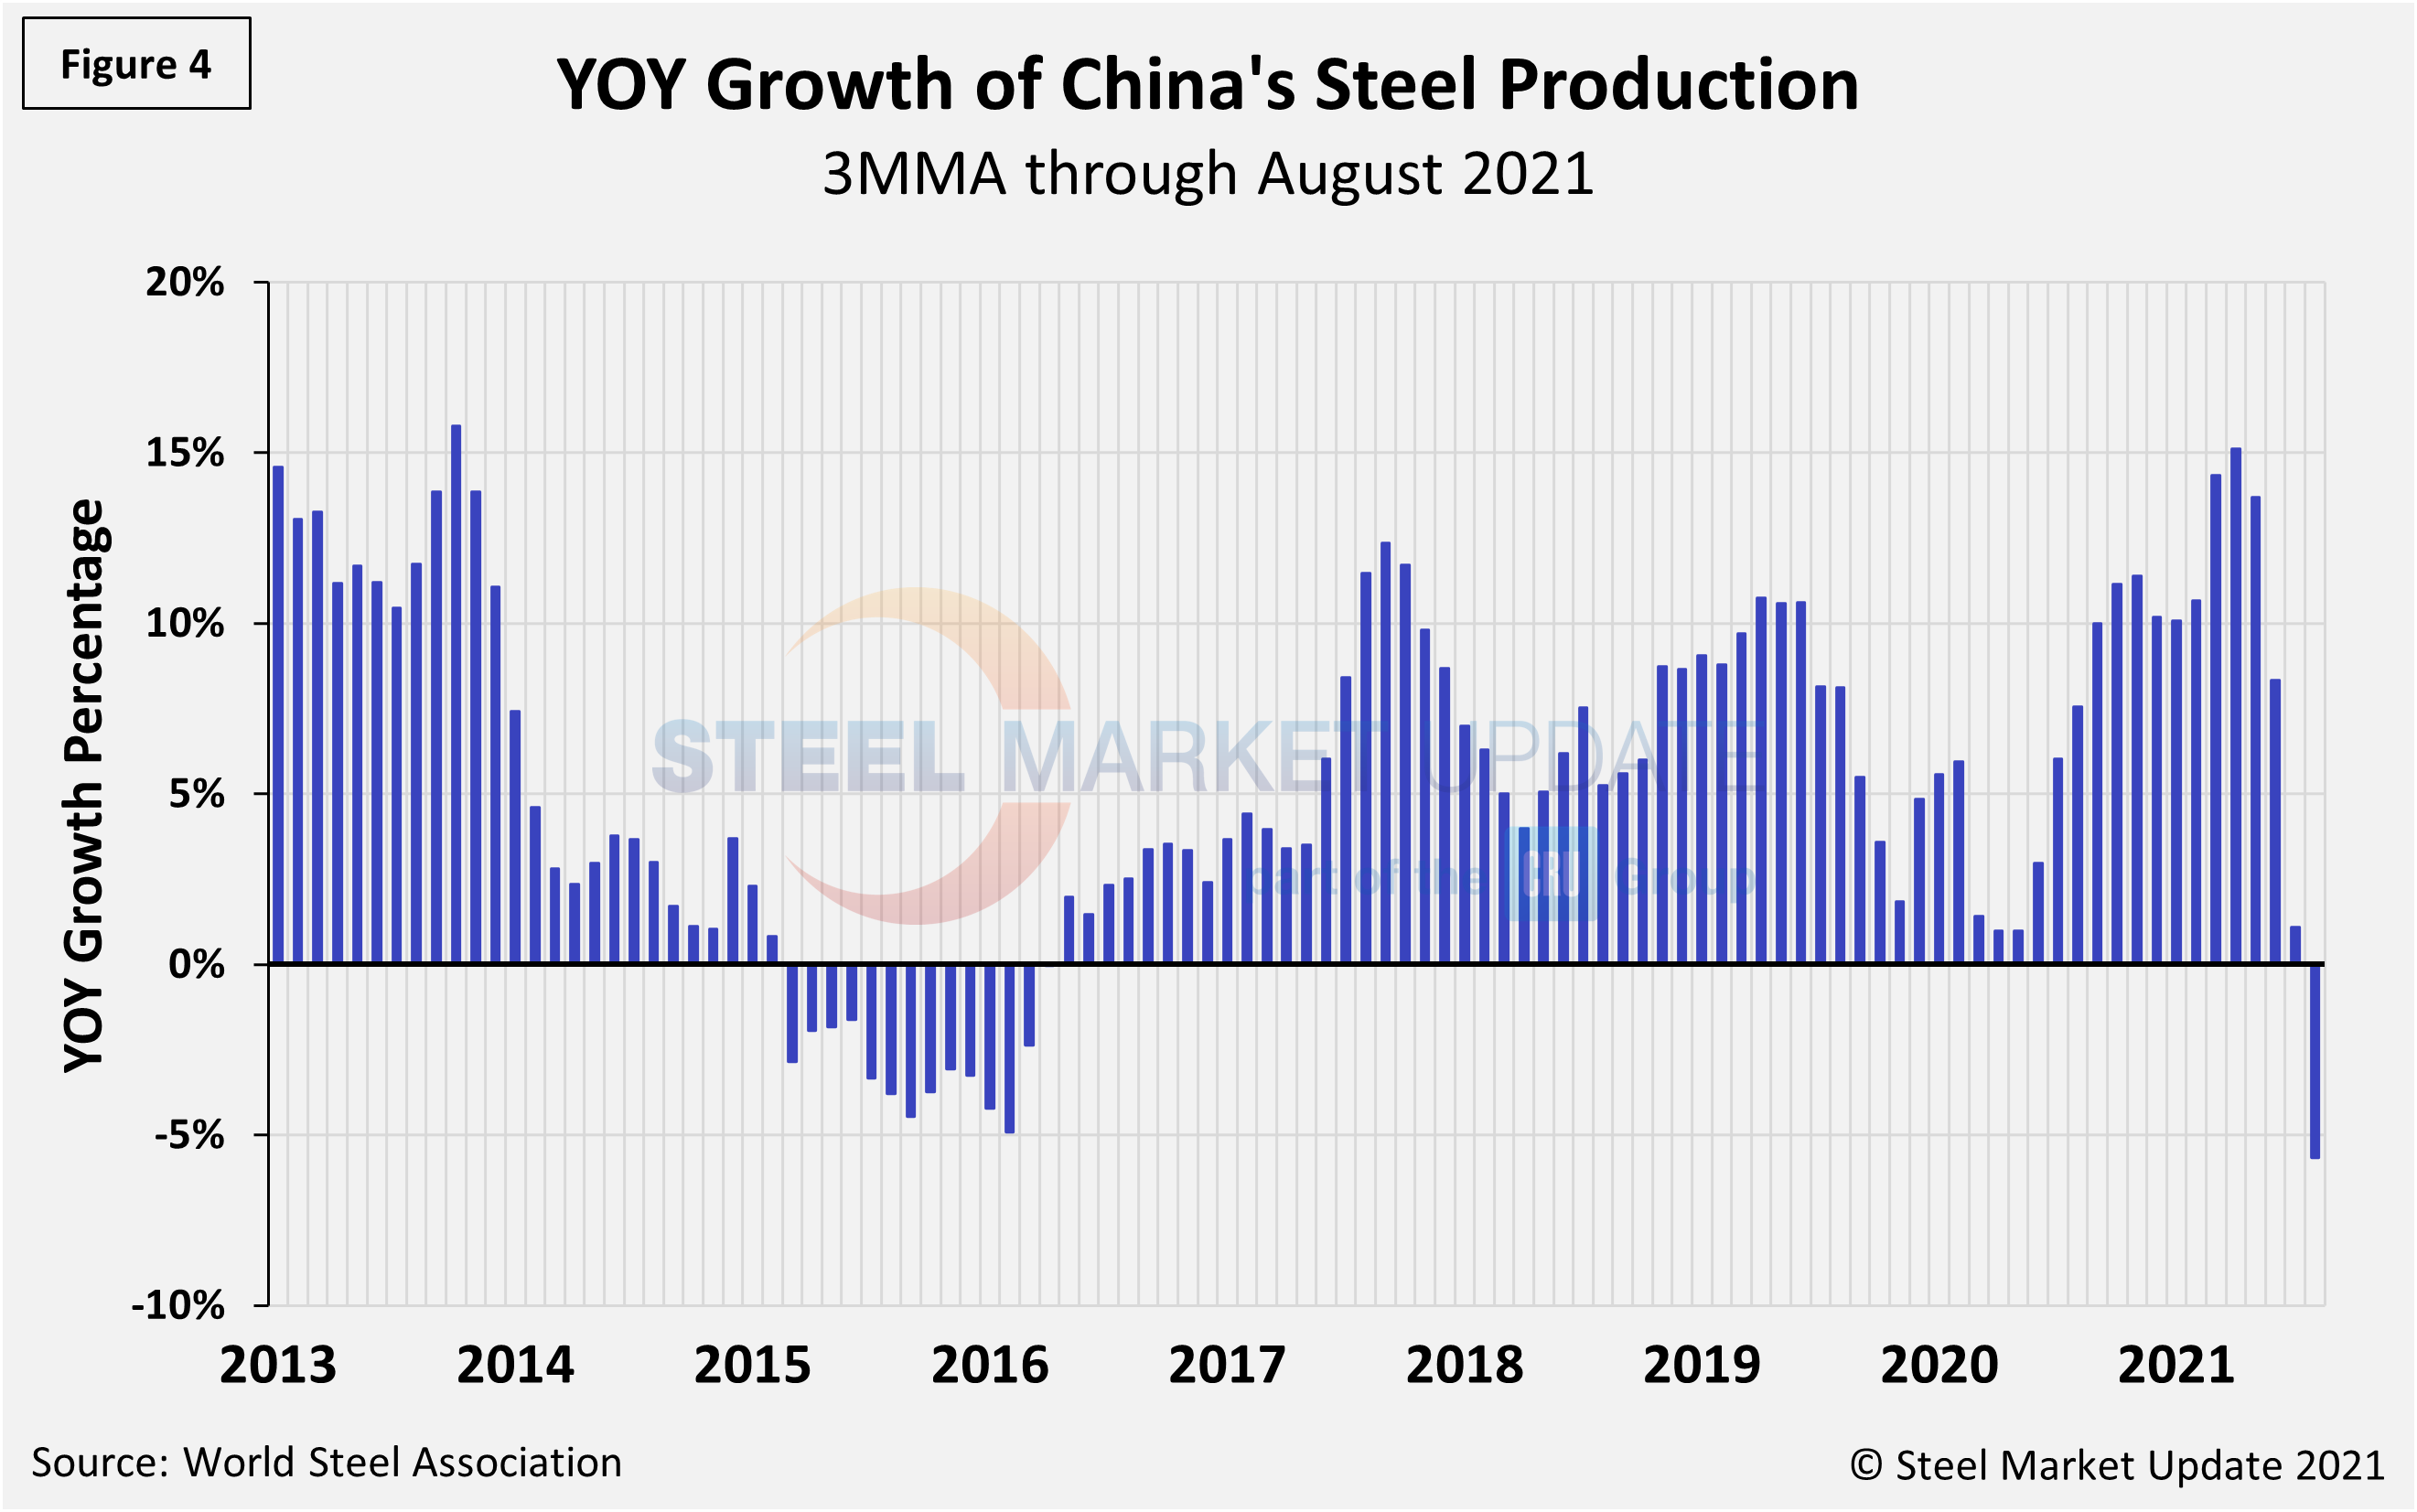
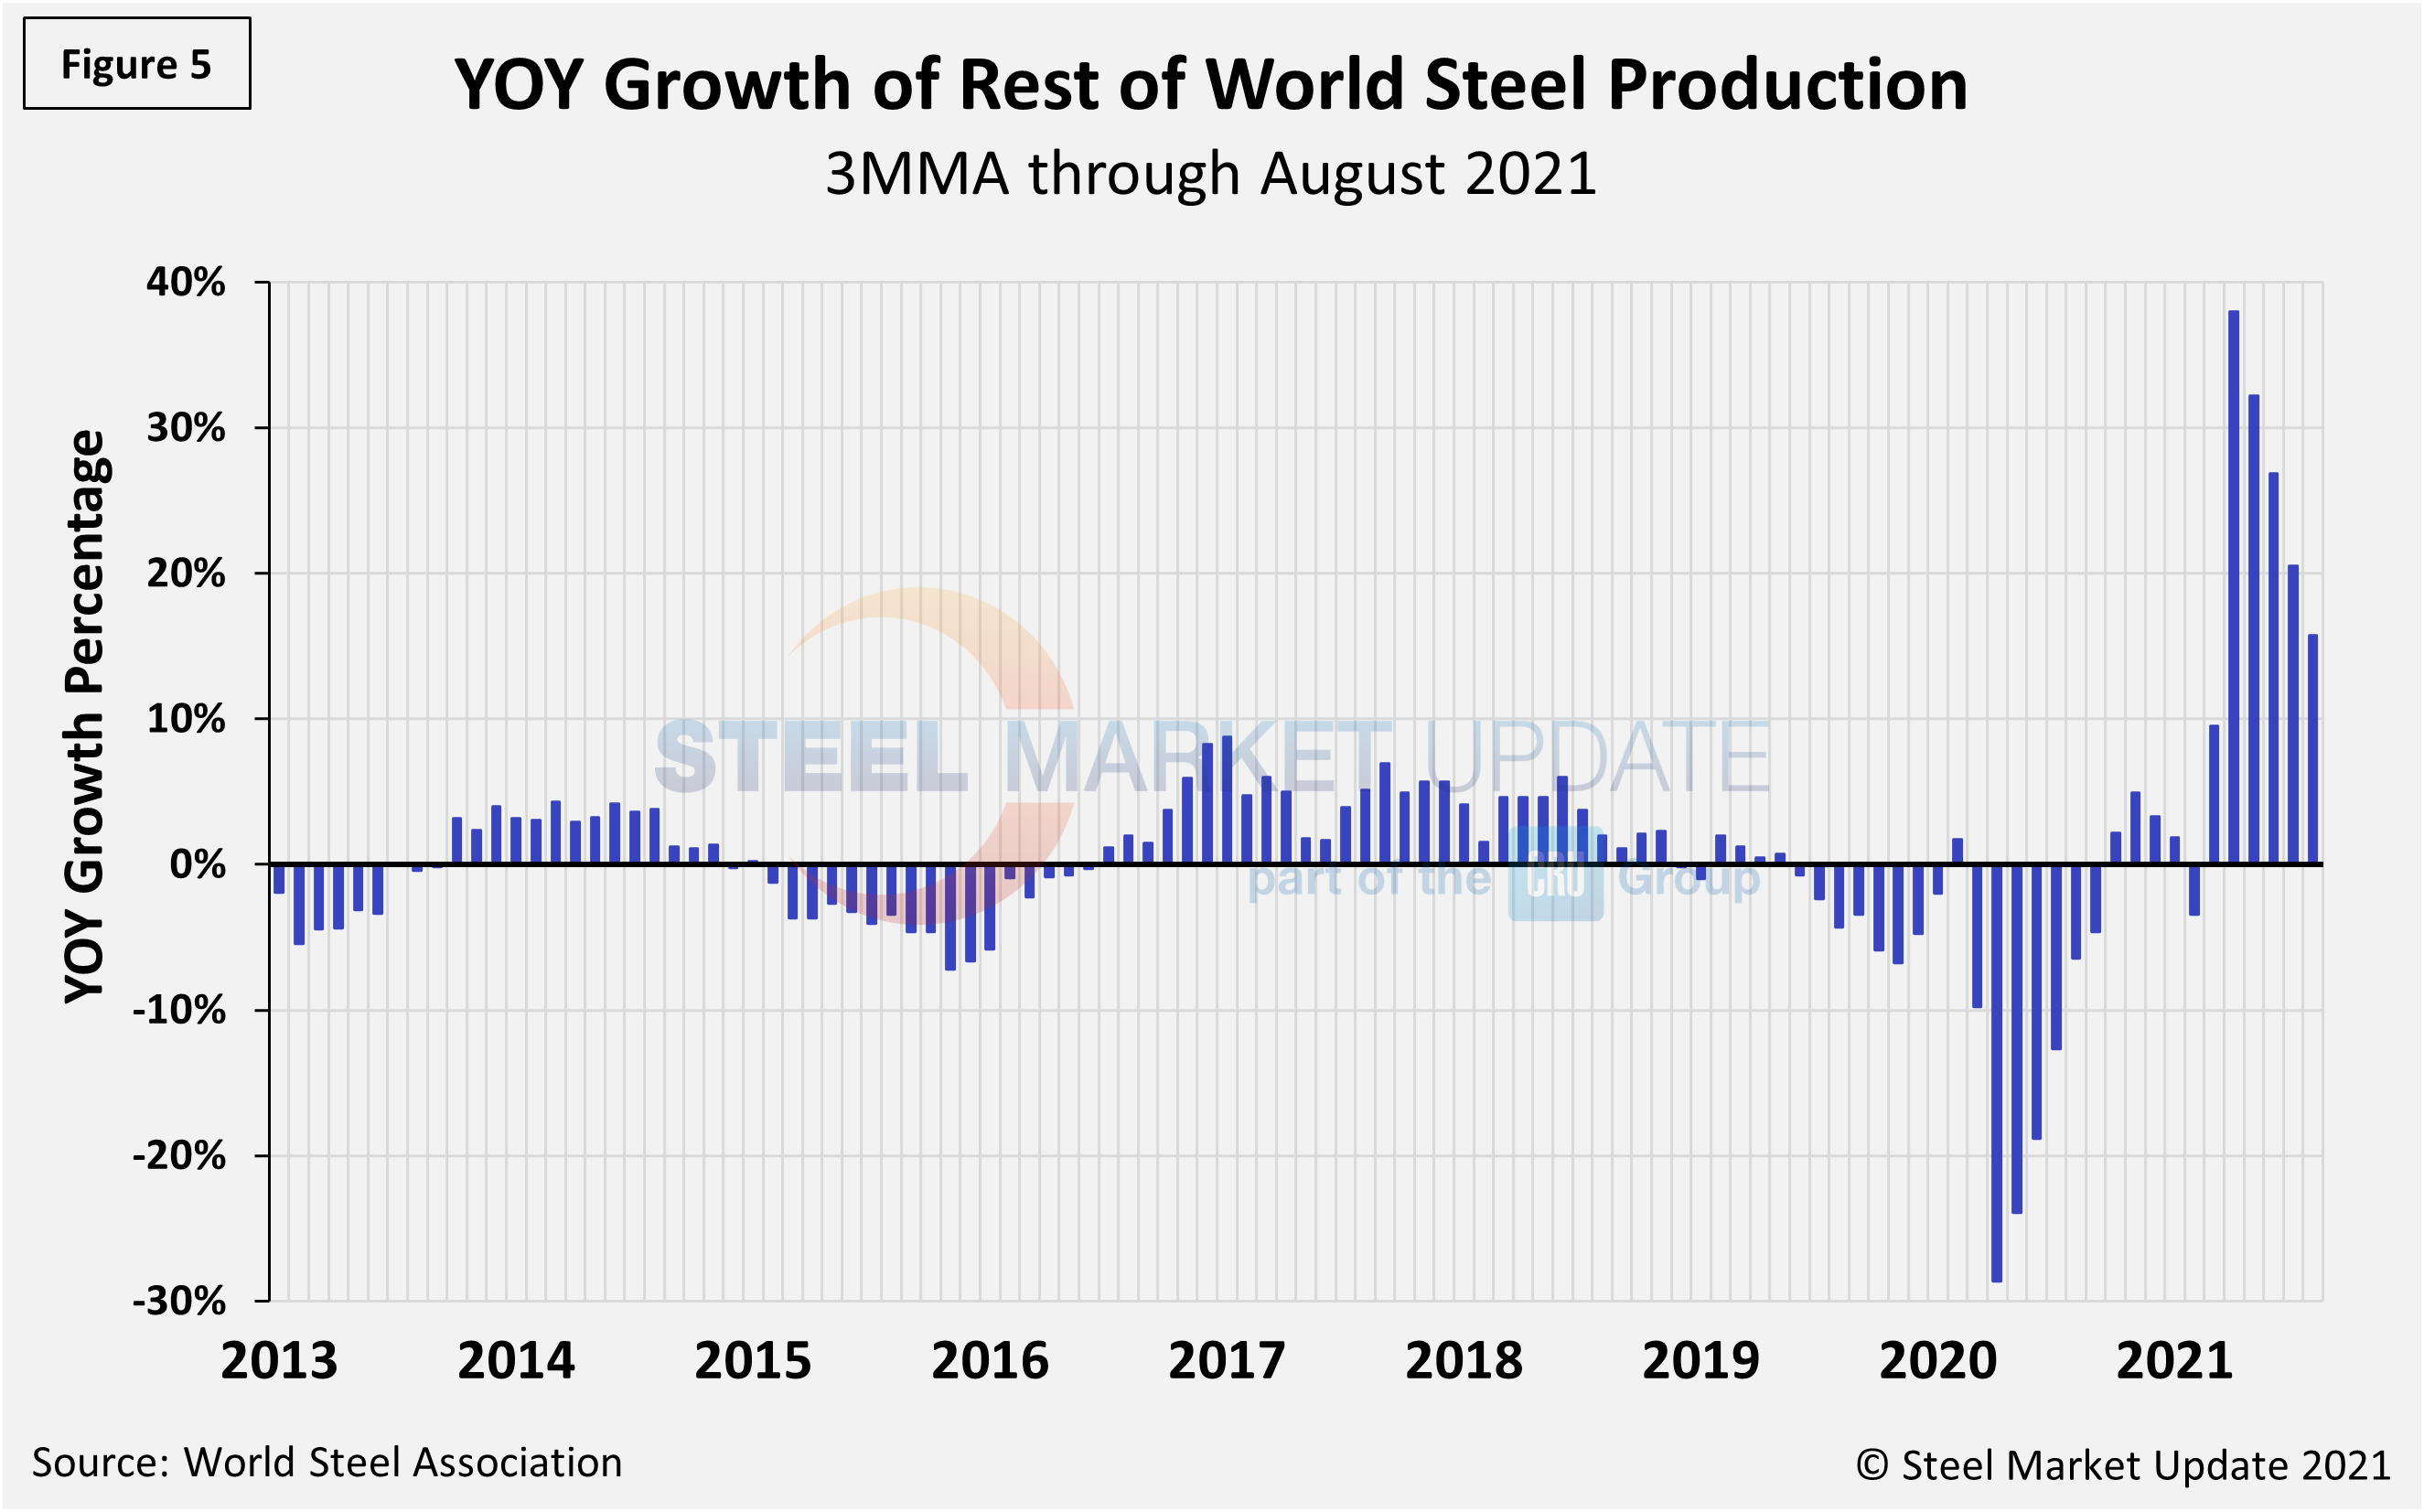
The fluctuations in China’s steel production since April 2013 are shown in Figure 4, while Figure 5 shows the growth of global steel excluding China, both on a 3MMA basis. From November 2020 through August 2021, the rest of the world’s production rose sharply, reaching a peak of 38.0% in April. Since then, the rate for the rest of the world’s annual production has decreased sequentially to 15.7% in August. China’s annual growth rate was -5.7% in August, a decrease from 1.1% in July, and a big decline from a high of 15.1% in April. It’s also the first negative growth rate since March 2016. The sharp downturn in steel production continues to be attributable to power shortages resulting from hot weather and the Chinese government’s efforts to curb harmful air emissions from the steel industry.
By David Schollaert, David@SteelMarketUpdate.com


