

Market Data

October 5, 2021
Manufacturing Indicators Holding Strong, Reach Multi-Year Highs in August
Written by Brett Linton
Steel Market Update is pleased to share this Premium content with Executive members. For information on upgrading to a Premium-level subscription, email Info@SteelMarketUpdate.com.
Data on U.S. industrial production, capacity utilization, new orders and inventories continued to improve through August, indicating a strengthening manufacturing sector. The health of the manufacturing economy has a direct bearing on the health of the steel industry. Note that some of the historical data below has been adjusted by the U.S. Census Bureau and Federal Reserve, with some revisions going back as far as the mid-2000s.
![]() The Industrial Production Index
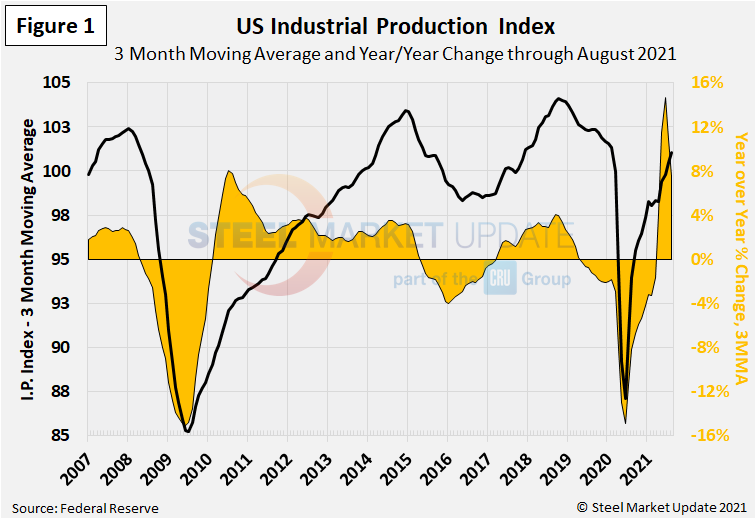
The Industrial Production Index
The IP index is a gauge of output from factories, mines and utilities. Industrial production took a serious hit from the shutdowns of nonessential businesses and other measures mandated by the government in mid-2020 to stem the spread of the coronavirus. Figure 1 shows the three-month moving average (3MMA) of the IP index since February 2007 as the black line and the year-over-year change in orange. We use the 3MMA calculations here to smooth out some of the monthly variability. From March through June 2020, the 3MMA of the IP index declined 13%, reaching a 10-year low of 87.1. The 3MMA has recovered nearly each month since, climbing to 101.0 in August, up 7.5% over the same period last year and the highest measure since February 2020.
Manufacturing Capacity Utilization
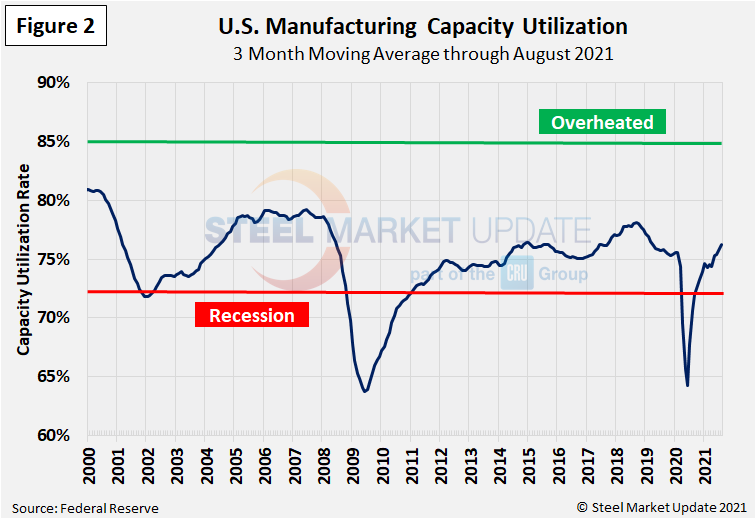
Manufacturing capacity utilization through August was measured at 76.2% as a 3MMA, the 10th consecutive month above recessionary territory, and the highest 3MMA rate recorded since March 2019. The rate had hovered around 75% for most of the 2010’s, but began to decline in April 2020 and reached a low of 64% in June 2020 (Figure 2).
New Orders for Durable Goods
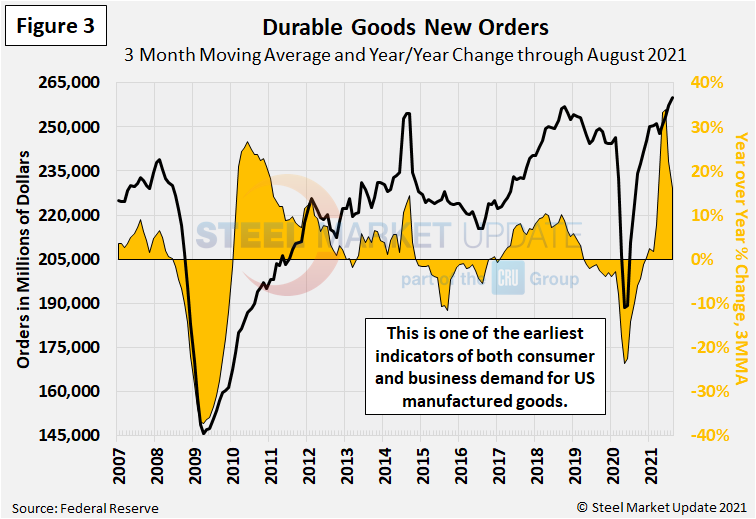
New orders for durable goods, an early indicator of consumer and business demand for U.S. manufactured goods, continued to recover from the shock last year and reached a new record level in August (Figure 3). New orders increased to $260.0 billion as a 3MMA through August 2021, the highest level in our 29-year history. The 3MMA had dropped by 23% from February through May 2020, from $246.4 billion down to $188.4 billion.
New Orders for Manufactured Products
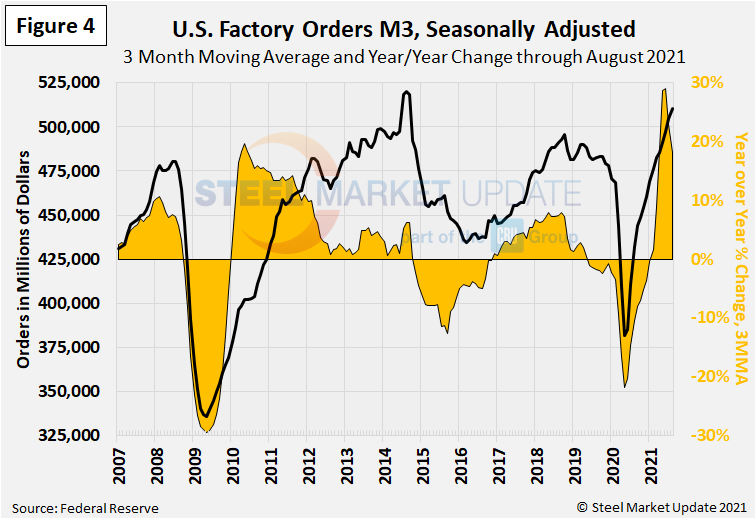
The growth rate of new orders for manufactured products as reported by the Census Bureau was slightly negative for most of 2019, then declined sharply from March to July 2020 (Figure 4). On a 3MMA basis, factory orders have increased each month since then, reaching $510 billion in August 2021. This is up 18.1% compared to one year prior, the highest 3MMA level seen since September 2014.
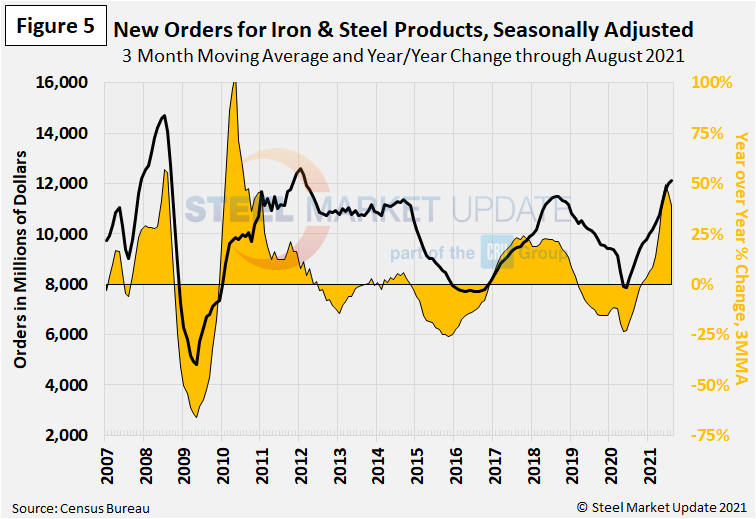
New Orders for Products Manufactured from Iron and Steel
Within the Census Bureau M3 manufacturing survey is a subsection for iron and steel products. Figure 5 shows the history of new orders for iron and steel products since 2007 as a 3MMA. The 3MMA year-over-year growth rate, which reached negative 23.4% last May, has climbed to a positive 39.0% as of August at $12.1 billion (3MMA). This is the highest new order level seen since February 2012. Back in June 2021, the 3MMA year-over-year growth rate reached a multi-year high of 49.6%, the highest rate since July 2010.
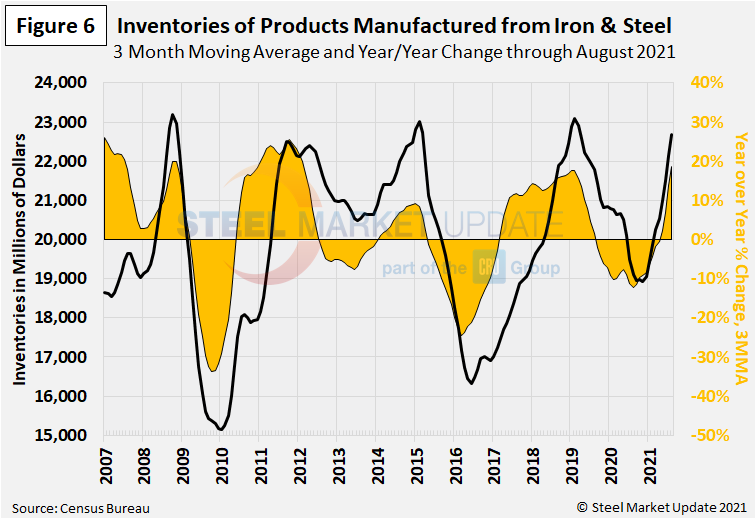
Inventories of Products Manufactured from Iron and Steel
Inventories of iron and steel products broke their multi-month decline streak in November 2020, and have risen each month since. The latest iron and steel inventory levels totaled $22.7 billion on a 3MMA basis in August, up 18.6% compared to the same period the year prior (Figure 6). This is now the highest 3MMA measure since March 2019, and the highest year-over-year change seen since February 2012.
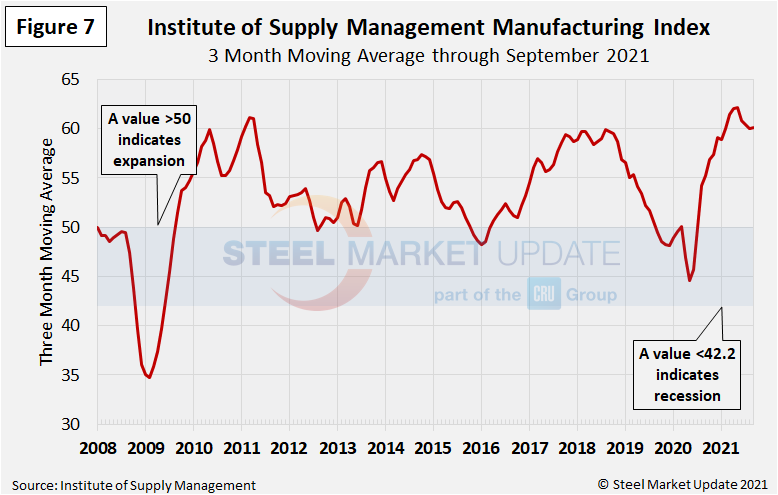
The ISM Manufacturing Index
The Institute for Supply Management’s Manufacturing Index is a diffusion index. An index value above 50 indicates that the manufacturing economy is expanding. As Figure 7 shows, the index on a 3MMA basis was in contraction territory from September 2019 through July 2020, reaching a low of 44.6 in May. The ISM index now stands at 60.2 through September as a 3MMA, up 0.2 percentage points from the month prior and remaining strong.
“Manufacturing performed well for the 16th straight month, with demand, consumption and inputs registering month-over-month growth, in spite of continuing unprecedented obstacles and ever-increasing demand. Panelists’ companies and their supply chains continue to struggle to meet demand due to difficulties in hiring and a clear cycle of labor turnover, as workers opt for more attractive job opportunities. Disruptions from COVID-19, primarily in Southeast Asia, continue to have an impact on many industry sectors. Congestion at ports in China and the U.S. continues to be a headwind, as transportation networks remain stressed. Demand remains at strong levels, despite increasing prices,” said ISM Business Survey Committee Chairman Timothy Fiore.
By Brett Linton, Brett@SteelMarketUpdate.com


