

Market Data

October 11, 2021
Shipments and Supply of Steel Products Through August
Written by David Schollaert
Mill shipments of steel products jumped 11.2% in August to 9.69 million tons, following an increase of 2.0% the month prior. Apparent supply was up 7.8% in August after a 3.6% increase in July. August’s expansion is the sixth straight month of growth in the steel supply since February’s double-digit contraction.
This analysis is based on steel mill shipment data from the American Iron and Steel Institute (AISI) and import-export data from the U.S. Department of Commerce (DOC). The analysis summarizes total steel supply by product from 2008 through August 2021 and year-on-year changes.
Steady downstream demand combined with supply limitations have raised steel prices to levels once thought unattainable over the past 14 months. Of late, steel supplies – including domestic production and imports – have been accelerating, bringing much needed balance to supply and demand fundamentals. Domestic mill utilization has remained around 85% on average over the past several weeks as mills are running near capacity and imports have been on the rise. Lead times have contracted as a result, and steel prices have reached an inflection point, with many suggesting the summit has already been reached.
SMU’s benchmark hot-rolled coil price range is $1,870-$1,970 per net ton with an average of $1,920 per ton FOB mill as of Oct. 12. That’s a decrease of approximately $30 per ton when compared to July’s analysis of shipments and supply of steel products. Raw steel production shown below in Figure 1 is based on weekly data from the AISI displayed as four-week moving averages.
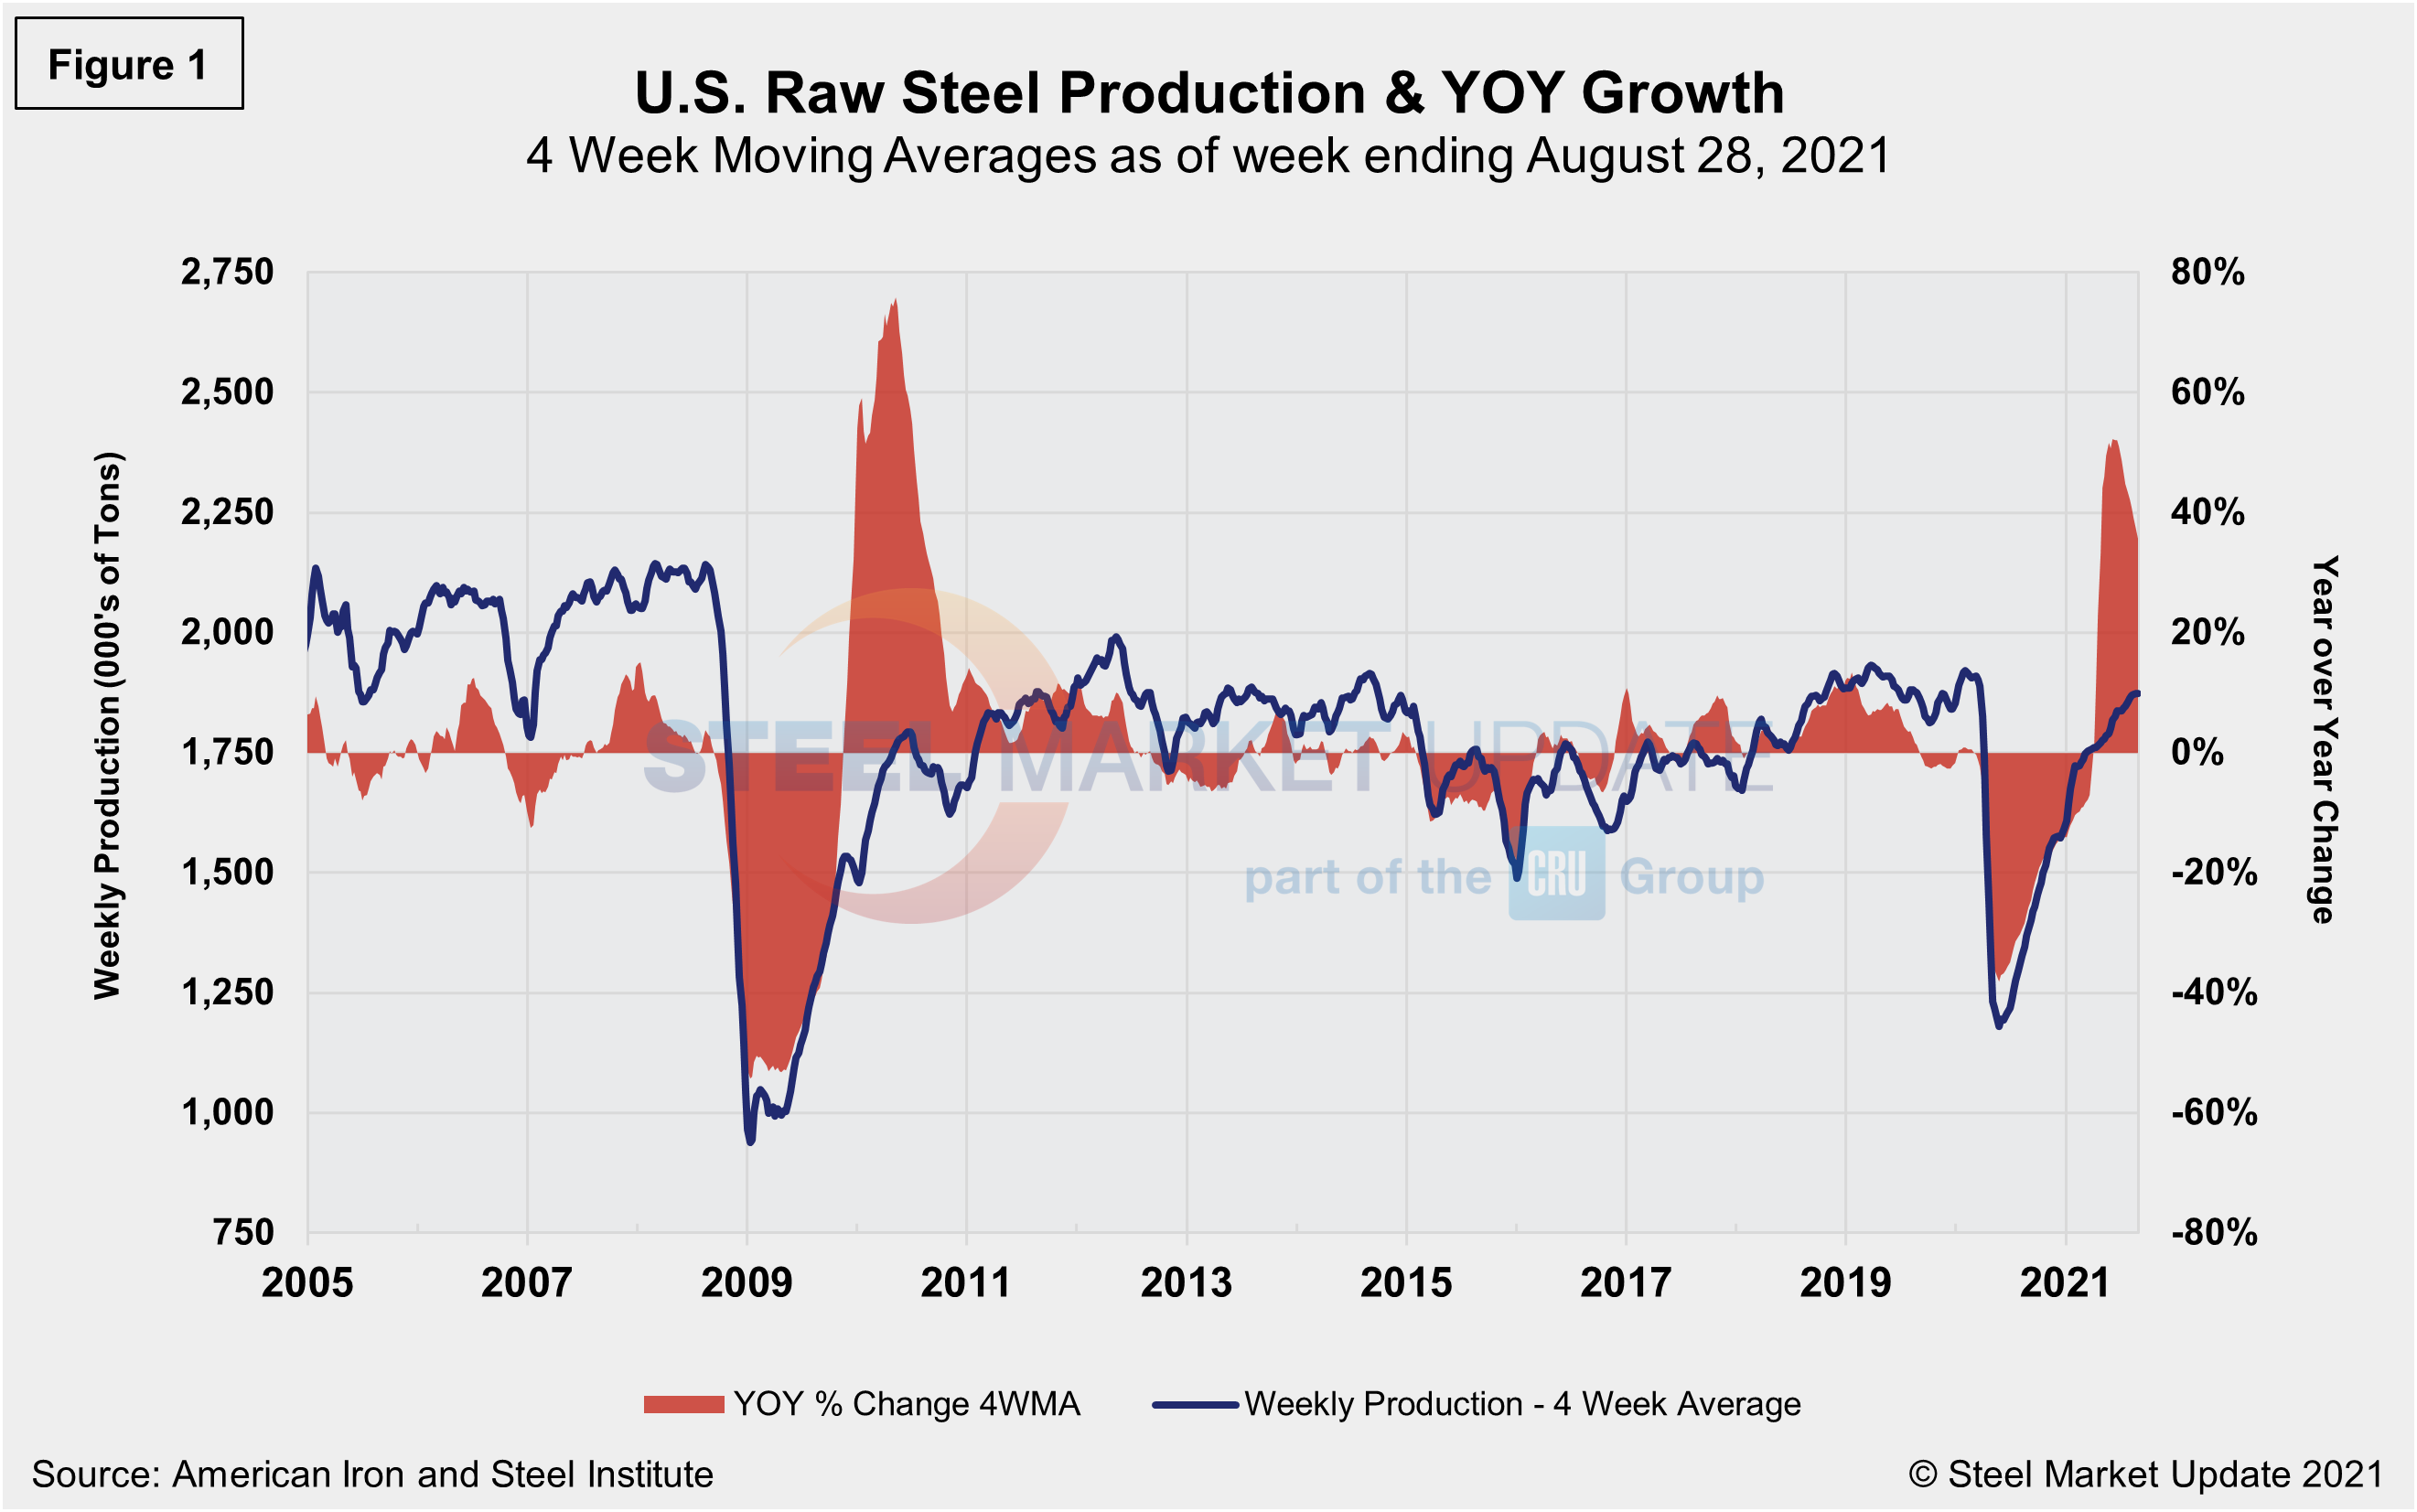
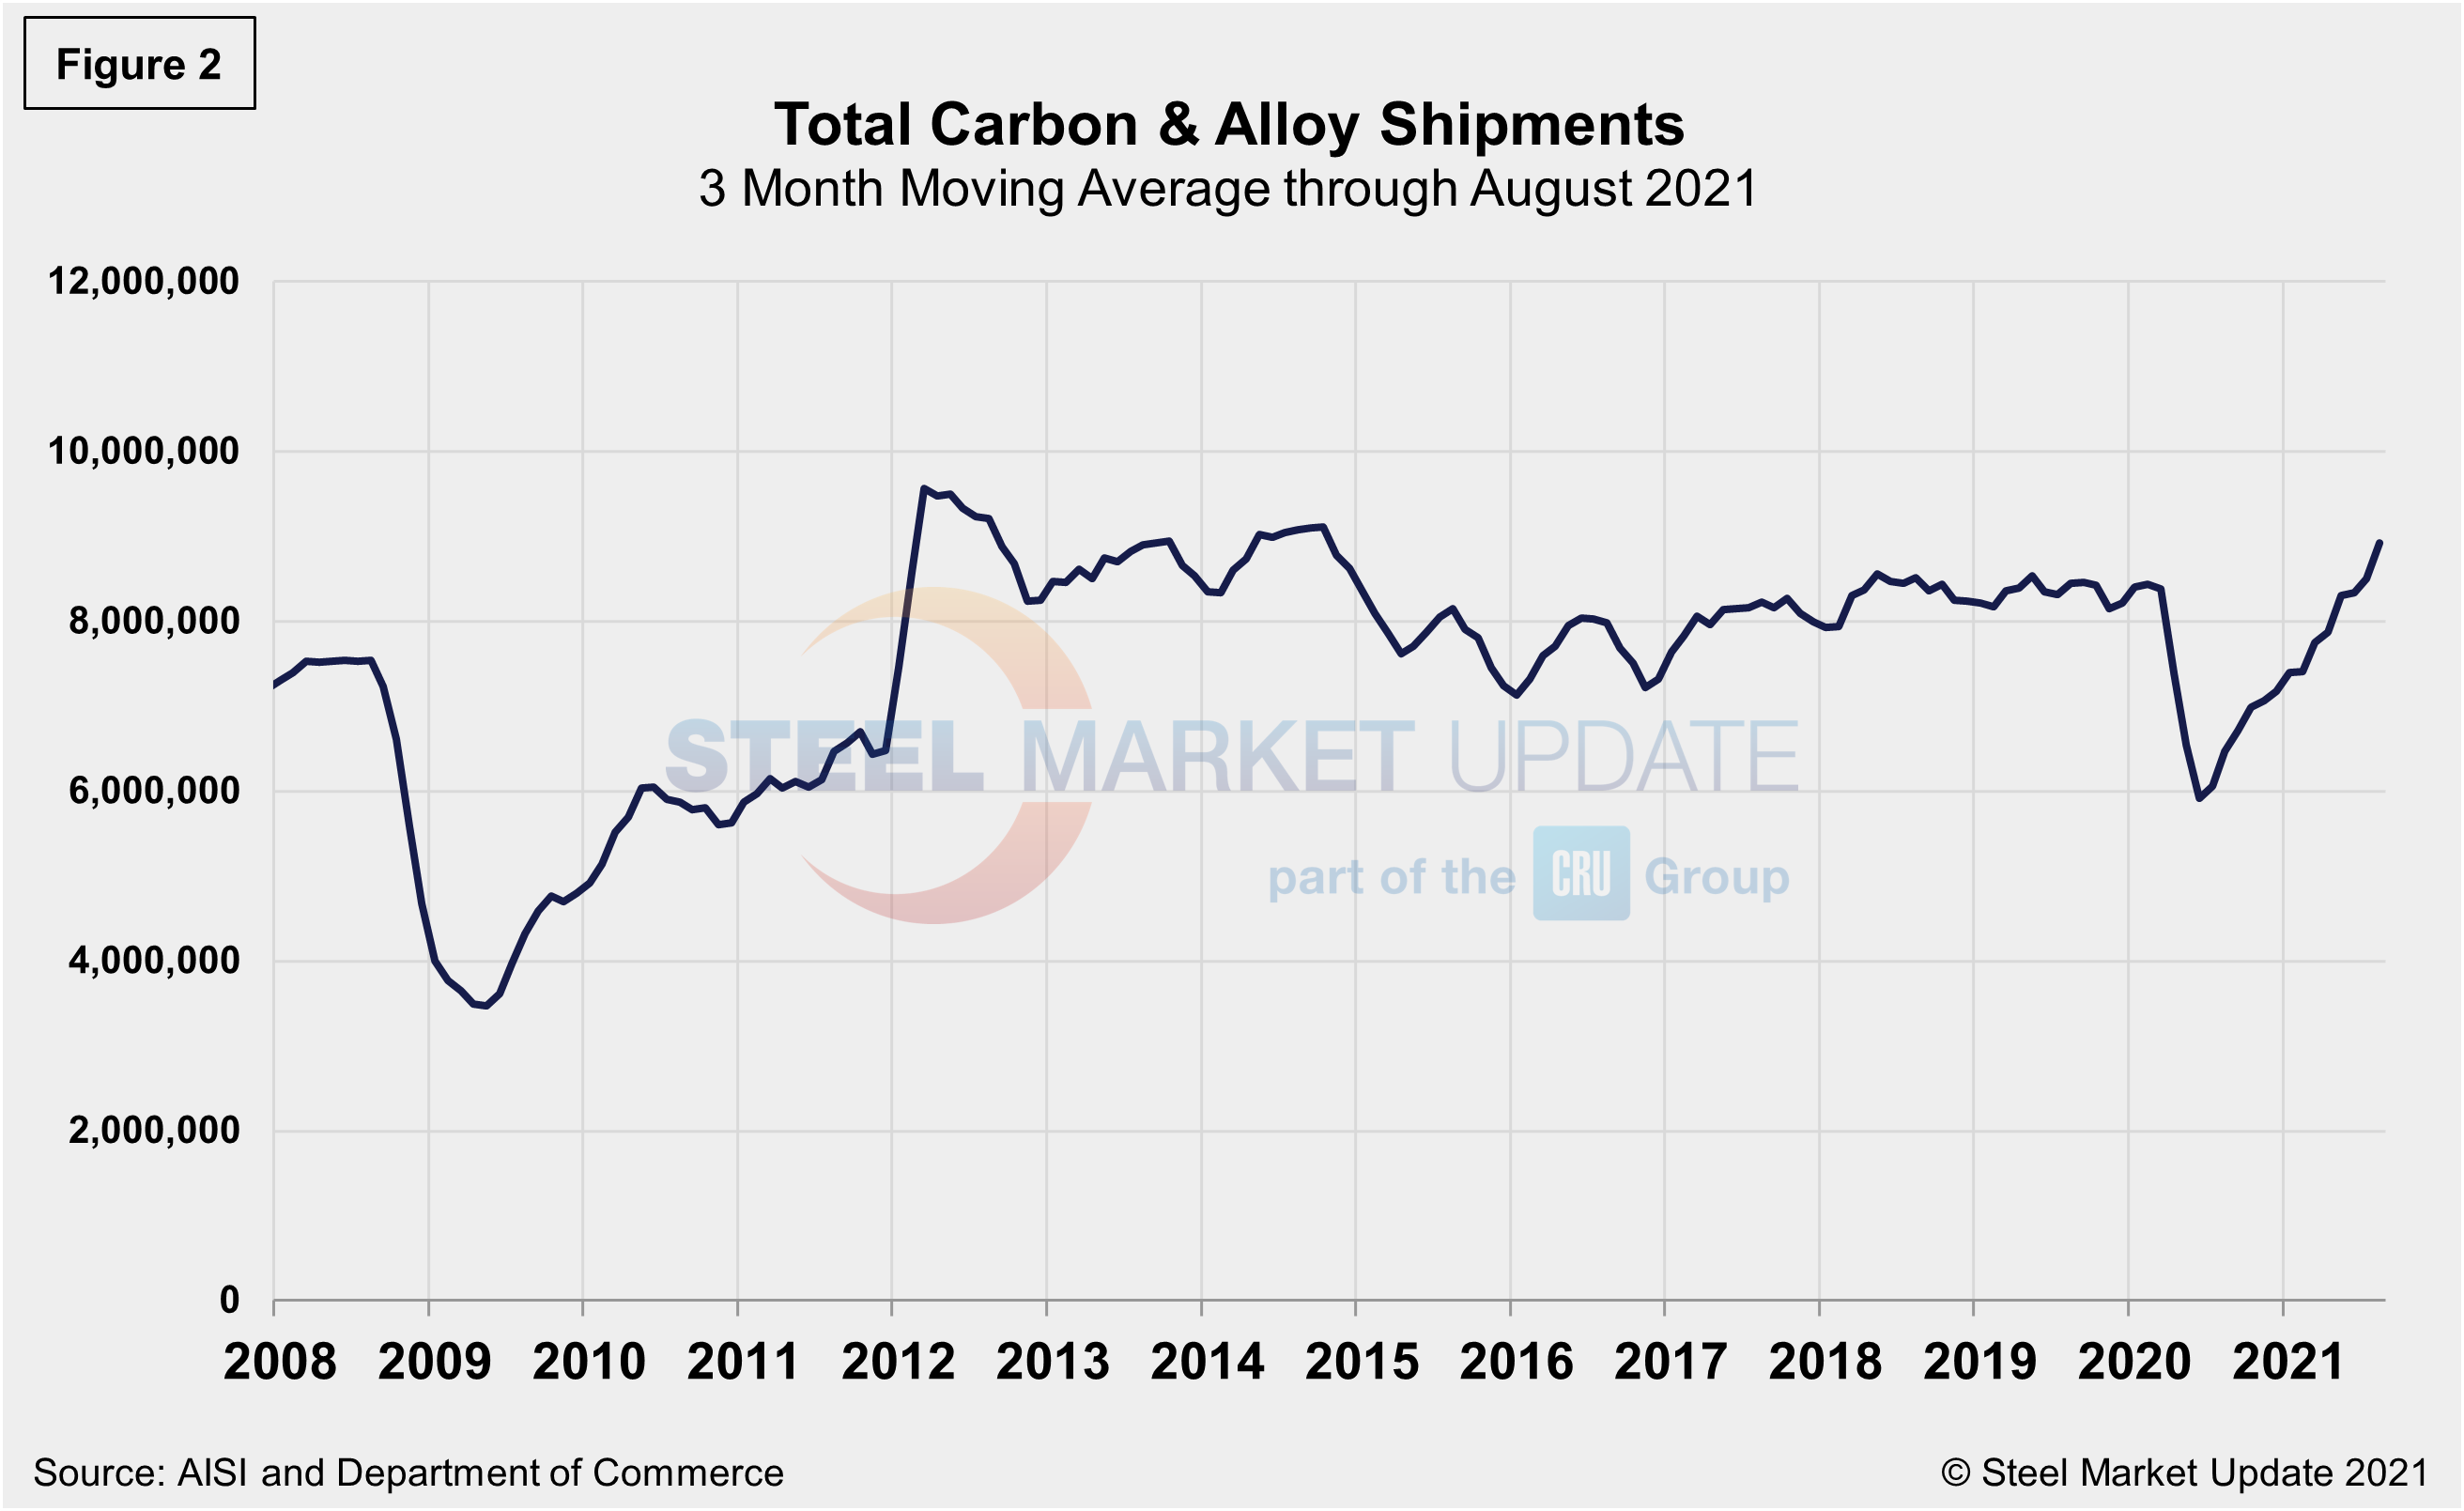
Monthly shipment data for all rolled steel products is noted in Figure 2. The trajectories of the rebounds since Q2 2020 are comparable in Figures 1 and 2. Measured as a three-month moving average (3MMA) of the monthly data, August’s total was 8.928 million tons, compared to 8.451 million tons in July, an increase of 5.0%. Shipments were up 38.0% in August compared to the year prior when shipments were 6.472 million tons. The recovery from the COVID-related shutdowns has been meaningful. Current shipments are up 5.7% from the same pre-pandemic period in 2019.
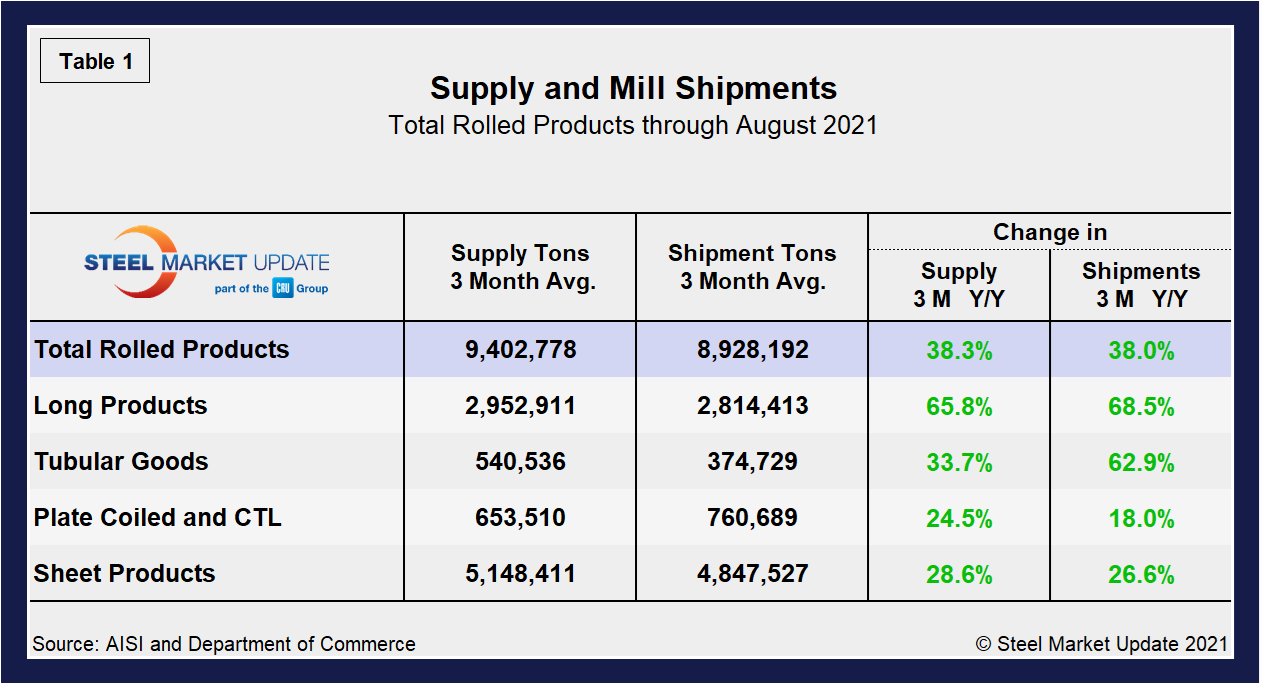
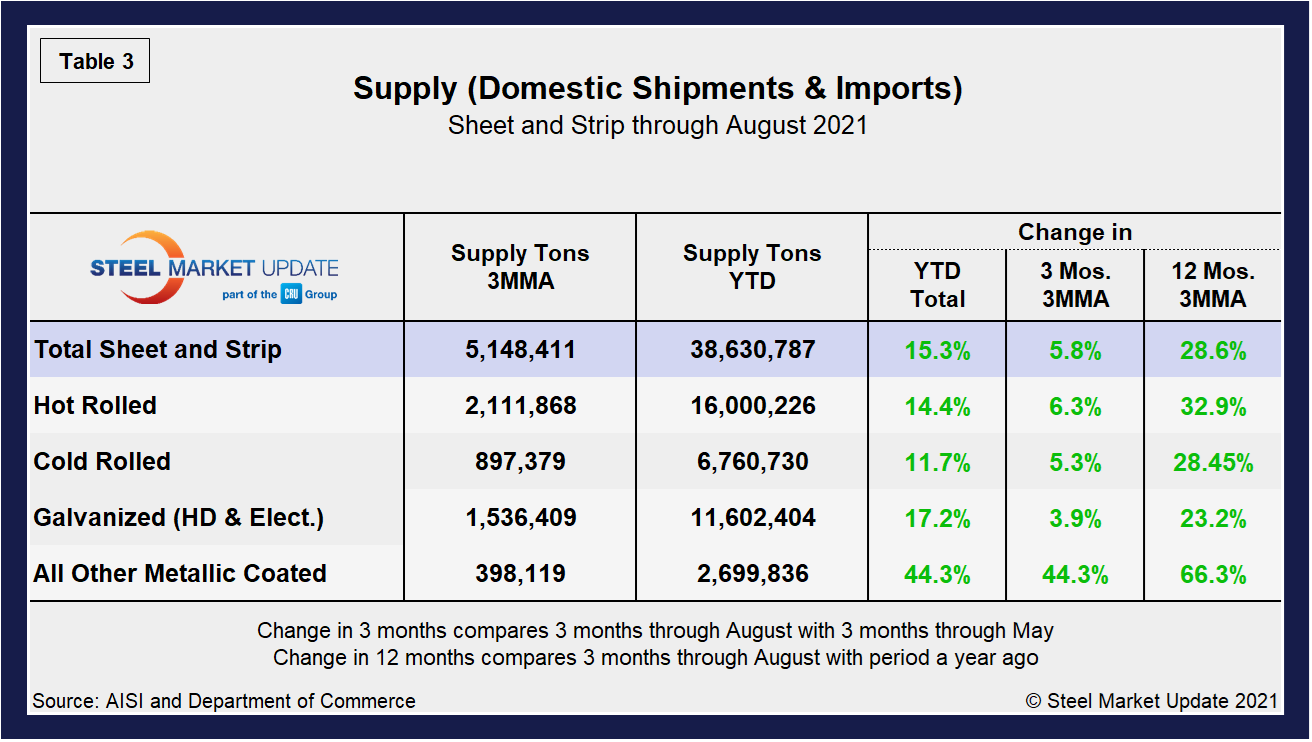
Shipment and supply details for all product groups are noted in Table 1, followed by individual sheet products in Table 2, and domestic supply (shipments and imports) in Table 3. Total supply (proxy for market demand) as a 3MMA was up 38.3% year over year in August, a big turnaround from the 24.6% decline last August as the market was trying to rebound from the pandemic-driven doldrums. Apparent supply is defined as domestic mill shipments to domestic locations plus imports. Mill shipments were up 38.0% in August, also a complete reversal from a decrease of 23.4% seen during the same year-ago period in the same 3MMA comparison. The recovery has varied significantly among various products, but should continue to trend up as foreign material and domestic production continue to rise.
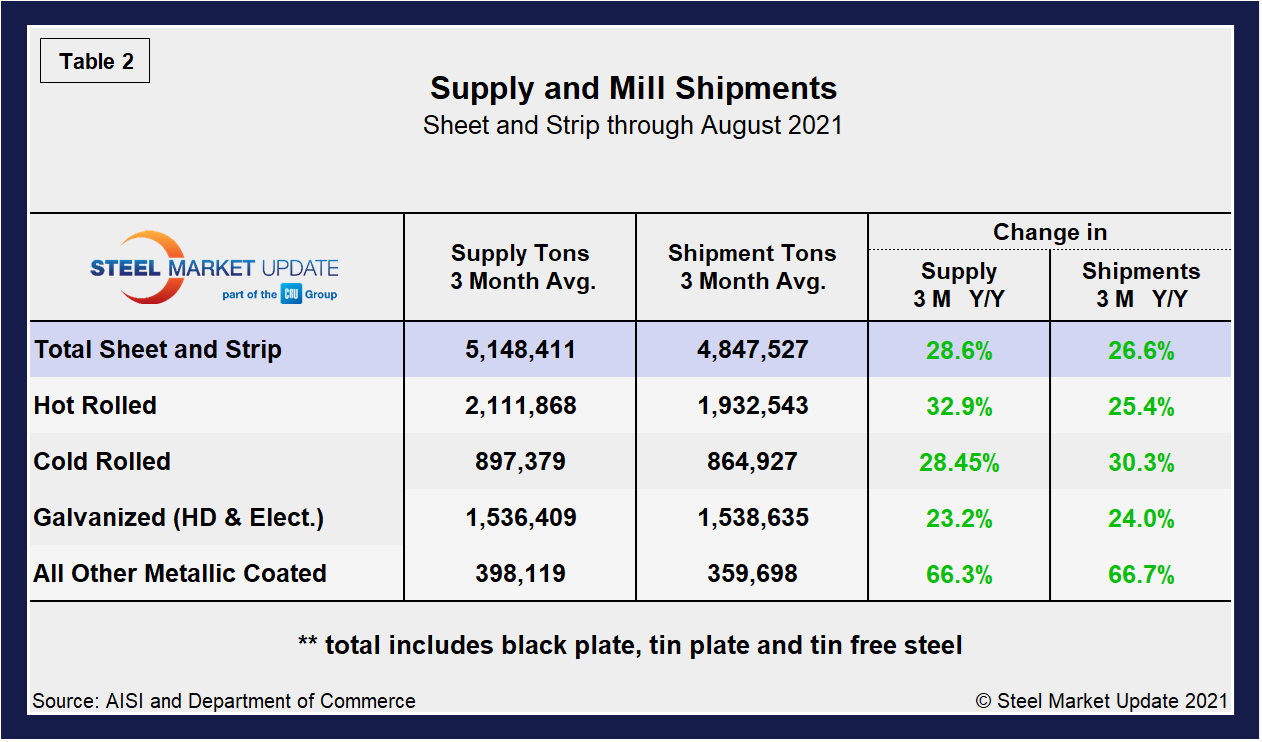
Overall sheet product shipments and supply (Table 2) have improved markedly month on month. Supply increased by 28.6% and shipments by 26.6% in August, a strong recovery from declines of 16.1% and 17.7% seen one year ago. In the three months through August 2021, the average monthly supply of sheet and strip was 5.148 million tons, up from 5.013 million tons or 2.7% above the prior month. Total sheet and strip apparent supply is up 15.3% year to date (Table 3) compared to 2020. Note that year-over-year comparisons have seasonality removed.
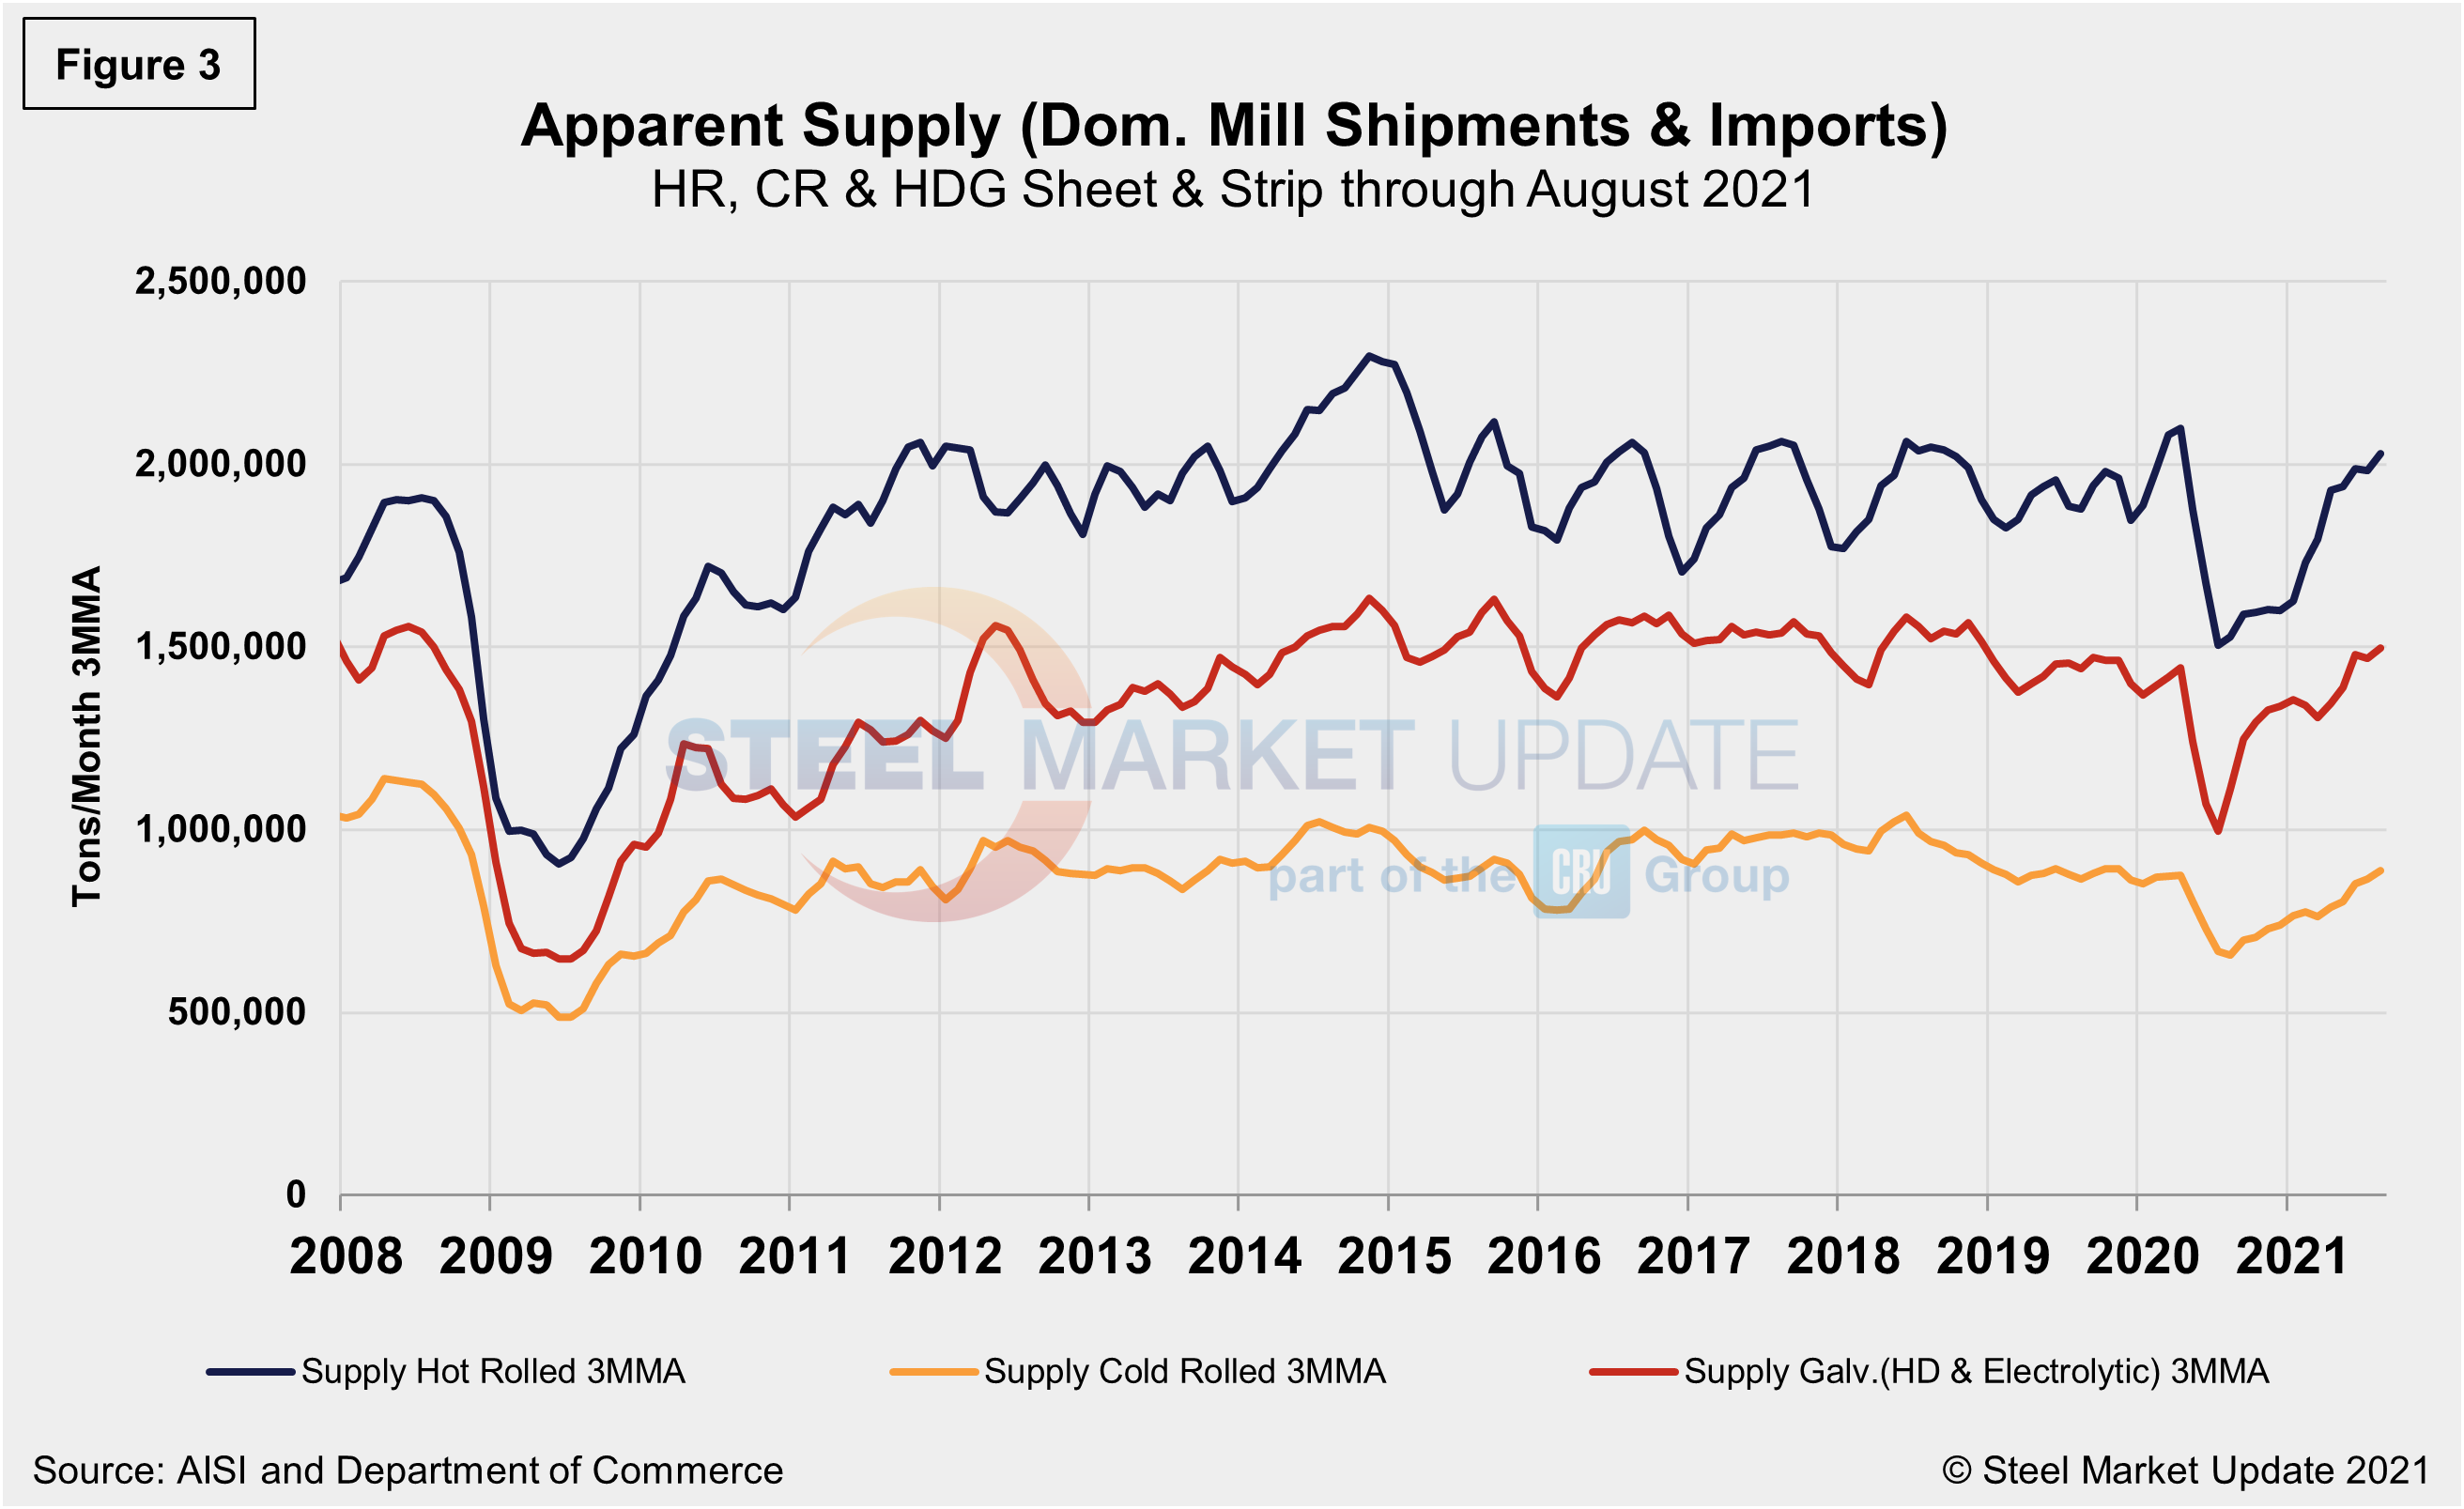
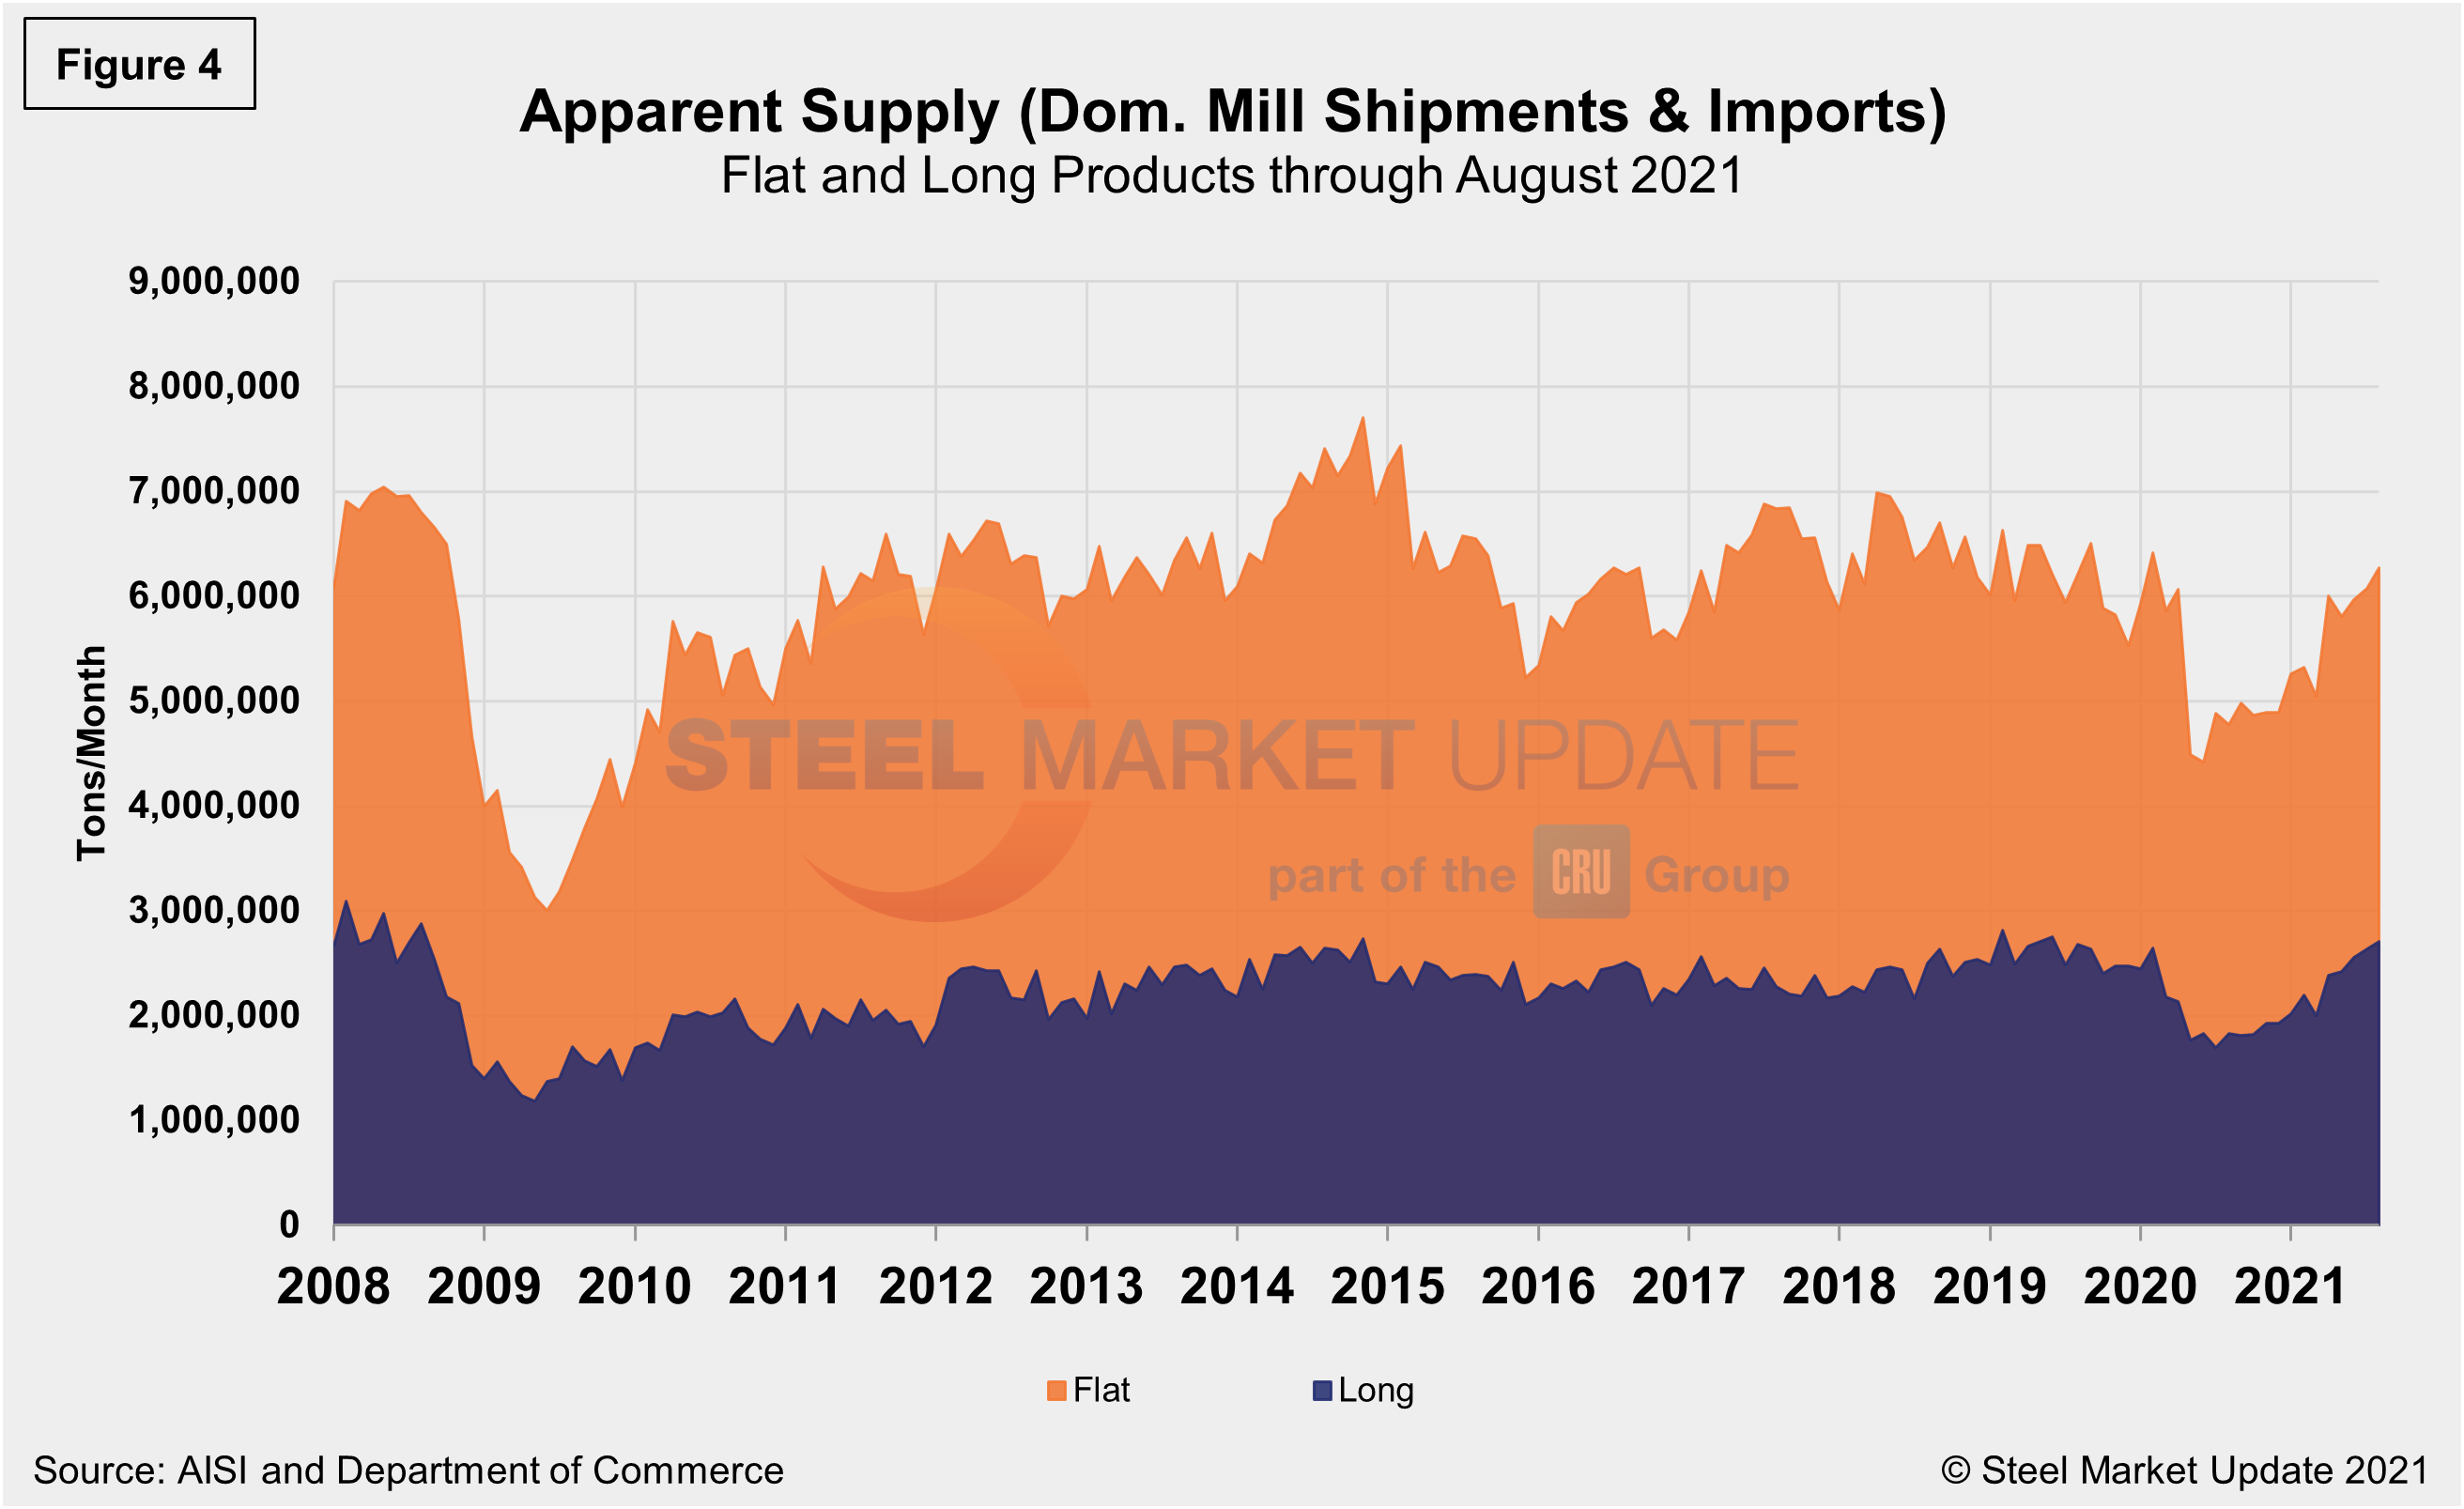
The supply picture for HRC, CRC and HDG since August 2008 as three-month moving averages in Figure 3 and Figure 4 shows the long-term comparison between flat and long products. All three sheet products have experienced some improvement since mid-2020, but galvanized (hot dipped and electrolytic) has seen the strongest rebound, a 54.1% jump since reaching bottom in June 2020, and up 2.6% month on month in August. When compared to the same pre-pandemic period in 2019, the supplies of all three products are presently higher; hot rolled coil at an 8.8% increase is the highest. In Figure 4, note that these are monthly numbers (not 3MMAs), which show the trend difference between longs and flat products including plate.
By David Schollaert, David@SteelMarketUpdate.com


