

Market Data

October 29, 2021
SMU Steel Buyers Sentiment: Slightly More Bearish?
Written by Tim Triplett
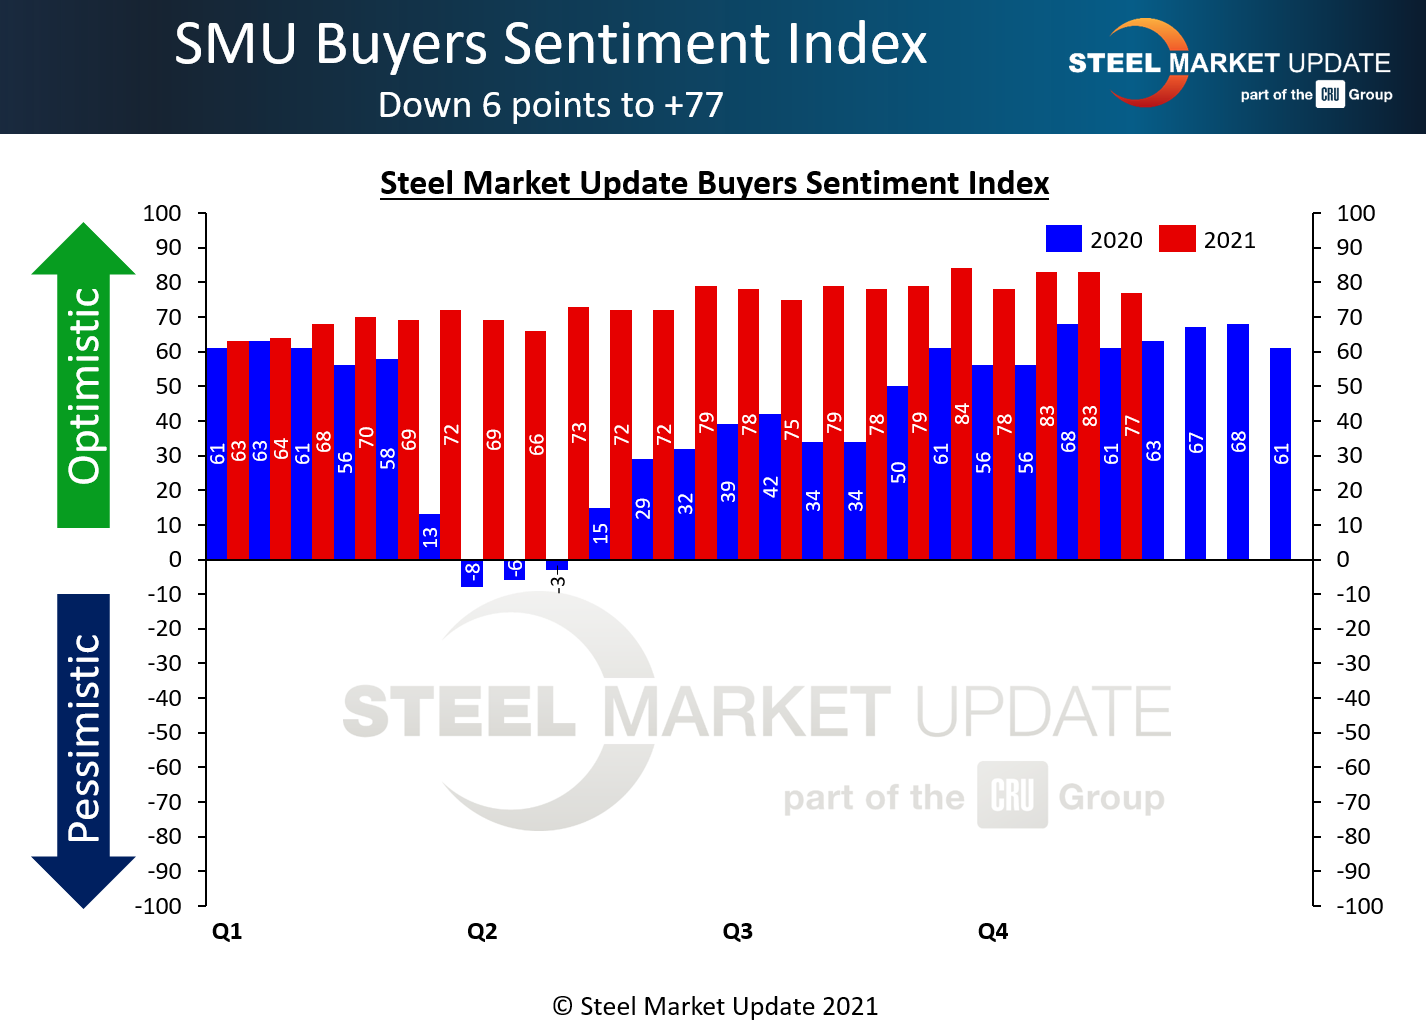
Despite all the uncertainty over the economy and steel prices as the year nears an end, sentiment among steel buyers remains extremely optimistic versus historical levels, as measured by Steel Market Update. But this week’s check of the market saw a small decline to the lowest sentiment reading since July.
SMU surveys buyers every two weeks and asks how they view their chances of success in the near and longer term. SMU’s Current Buyers Sentiment Index registered +77 – a decline of six points but still within shouting distance of its all-time high of +84 seen early last month.
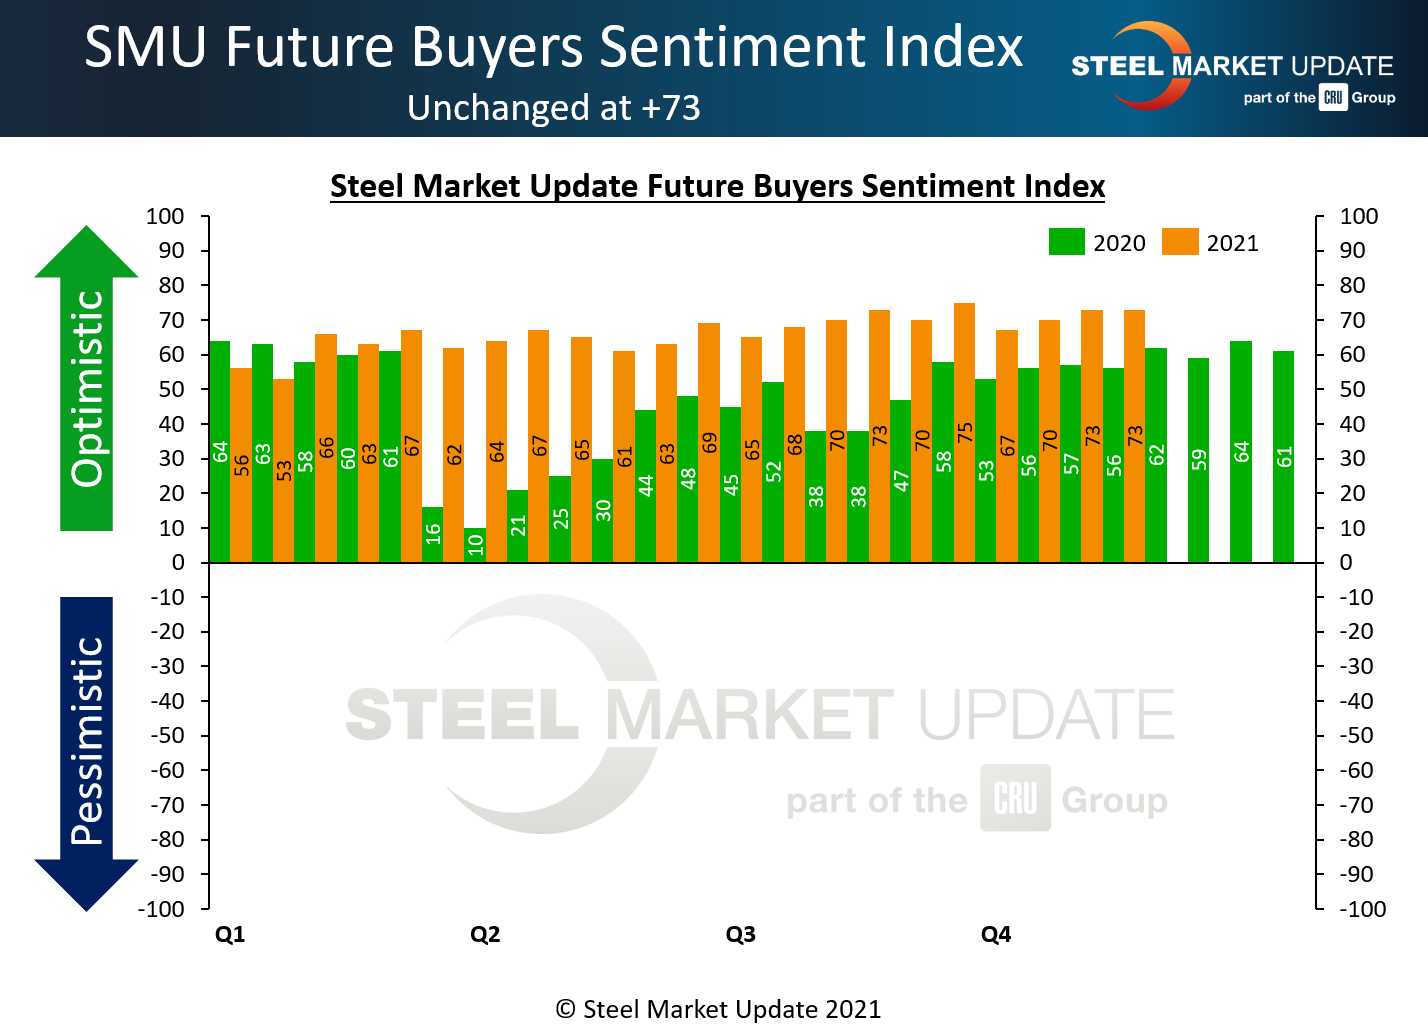
Future Sentiment – which measures steel buyers’ feelings about their prospects three to six months in the future – was unchanged at +73, near its all-time high of +77 seen in February 2018.
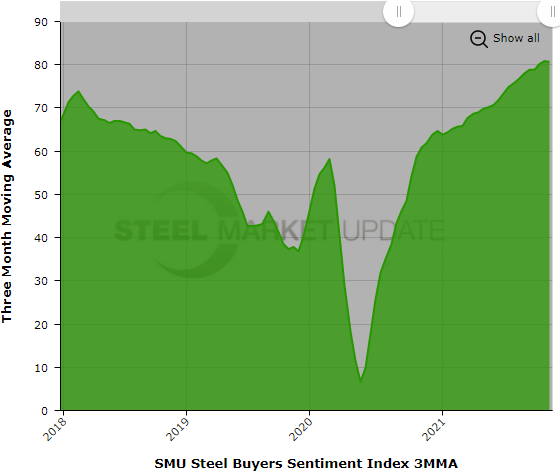
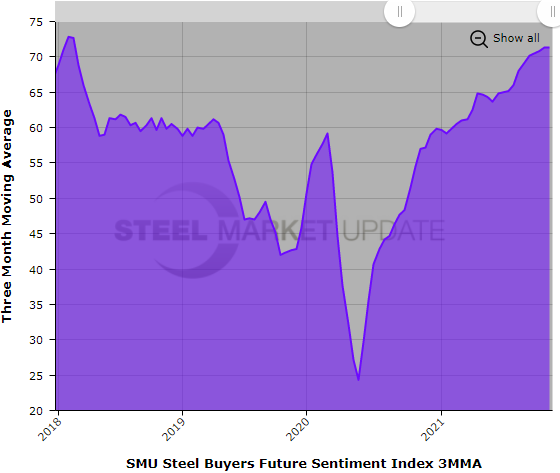
Measured as a three-month moving average (3MMA) to smooth out the variability, the Current Sentiment 3MMA stood at +80.67 this week, while the Future Sentiment 3MMA was at +71.33 – both basically unchanged and near record highs.
Sentiment tends to reflect the strength in steel pricing. Hot rolled steel prices have declined by 3-4% in the past two months. It’s more difficult to quantify human emotions, but this small dip in positivity seems proportional. If steel prices continue to moderate, we’ll be watching closely to see if buyers’ attitudes, and decision-making, get more bearish as well.
What Respondents Had to Say
“The market is still hot.”
“We are wrapping up the best October in our company history. Without a doubt, it’ll be our best Q4 ever, too.”
“The next three months? Excellent. Six months? Good. I still believe the 1H of ’22 will be off-the-charts. The back end is where I start to see some clouds forming.”
“The market’s still too volatile.”
“We need more production workers.”
“Uncertainty over trade cases and costs makes it too hard to predict.”
“Inflation factors will start hitting home to more people during the Christmas shopping season as things will be substantially more expensive than they were last year.”
About the SMU Steel Buyers Sentiment Index
SMU Steel Buyers Sentiment Index is a measurement of the current attitude of buyers and sellers of flat-rolled steel products in North America regarding how they feel about their company’s opportunity for success in today’s market. It is a proprietary product developed by Steel Market Update for the North American steel industry.
Positive readings run from +10 to +100. A positive reading means the meter on the right-hand side of our home page will fall in the green area indicating optimistic sentiment. Negative readings run from -10 to -100. They result in the meter on our homepage trending into the red, indicating pessimistic sentiment. A reading of “0” (+/- 10) indicates a neutral sentiment (or slightly optimistic or pessimistic), which is most likely an indicator of a shift occurring in the marketplace. Sentiment is measured via Steel Market Update surveys that are conducted twice per month. We display the meter on our home page for all to see.
We currently send invitations to participate in our survey to more than 600 North American companies. Our normal response rate is 100-150 companies. Approximately 40 percent are manufacturers, 45 percent are service centers/distributors, and 15 percent are steel mills, trading companies or toll processors involved in the steel business.
Click here to view an interactive graphic of the SMU Steel Buyers Sentiment Index or the SMU Future Steel Buyers Sentiment Index.
By Tim Triplett, Tim@SteelMarketUpdate.com


