

Market Data

November 10, 2021
Producer Prices Continue to Expand in October
Written by David Schollaert
Producer prices rose at a slightly higher rate in October, according to data released by the Labor Department. Supply-chain bottlenecks and shortages continue to drive manufacturing and shipping costs, keeping the historic climb for the index and subcategories for final demand moving up.
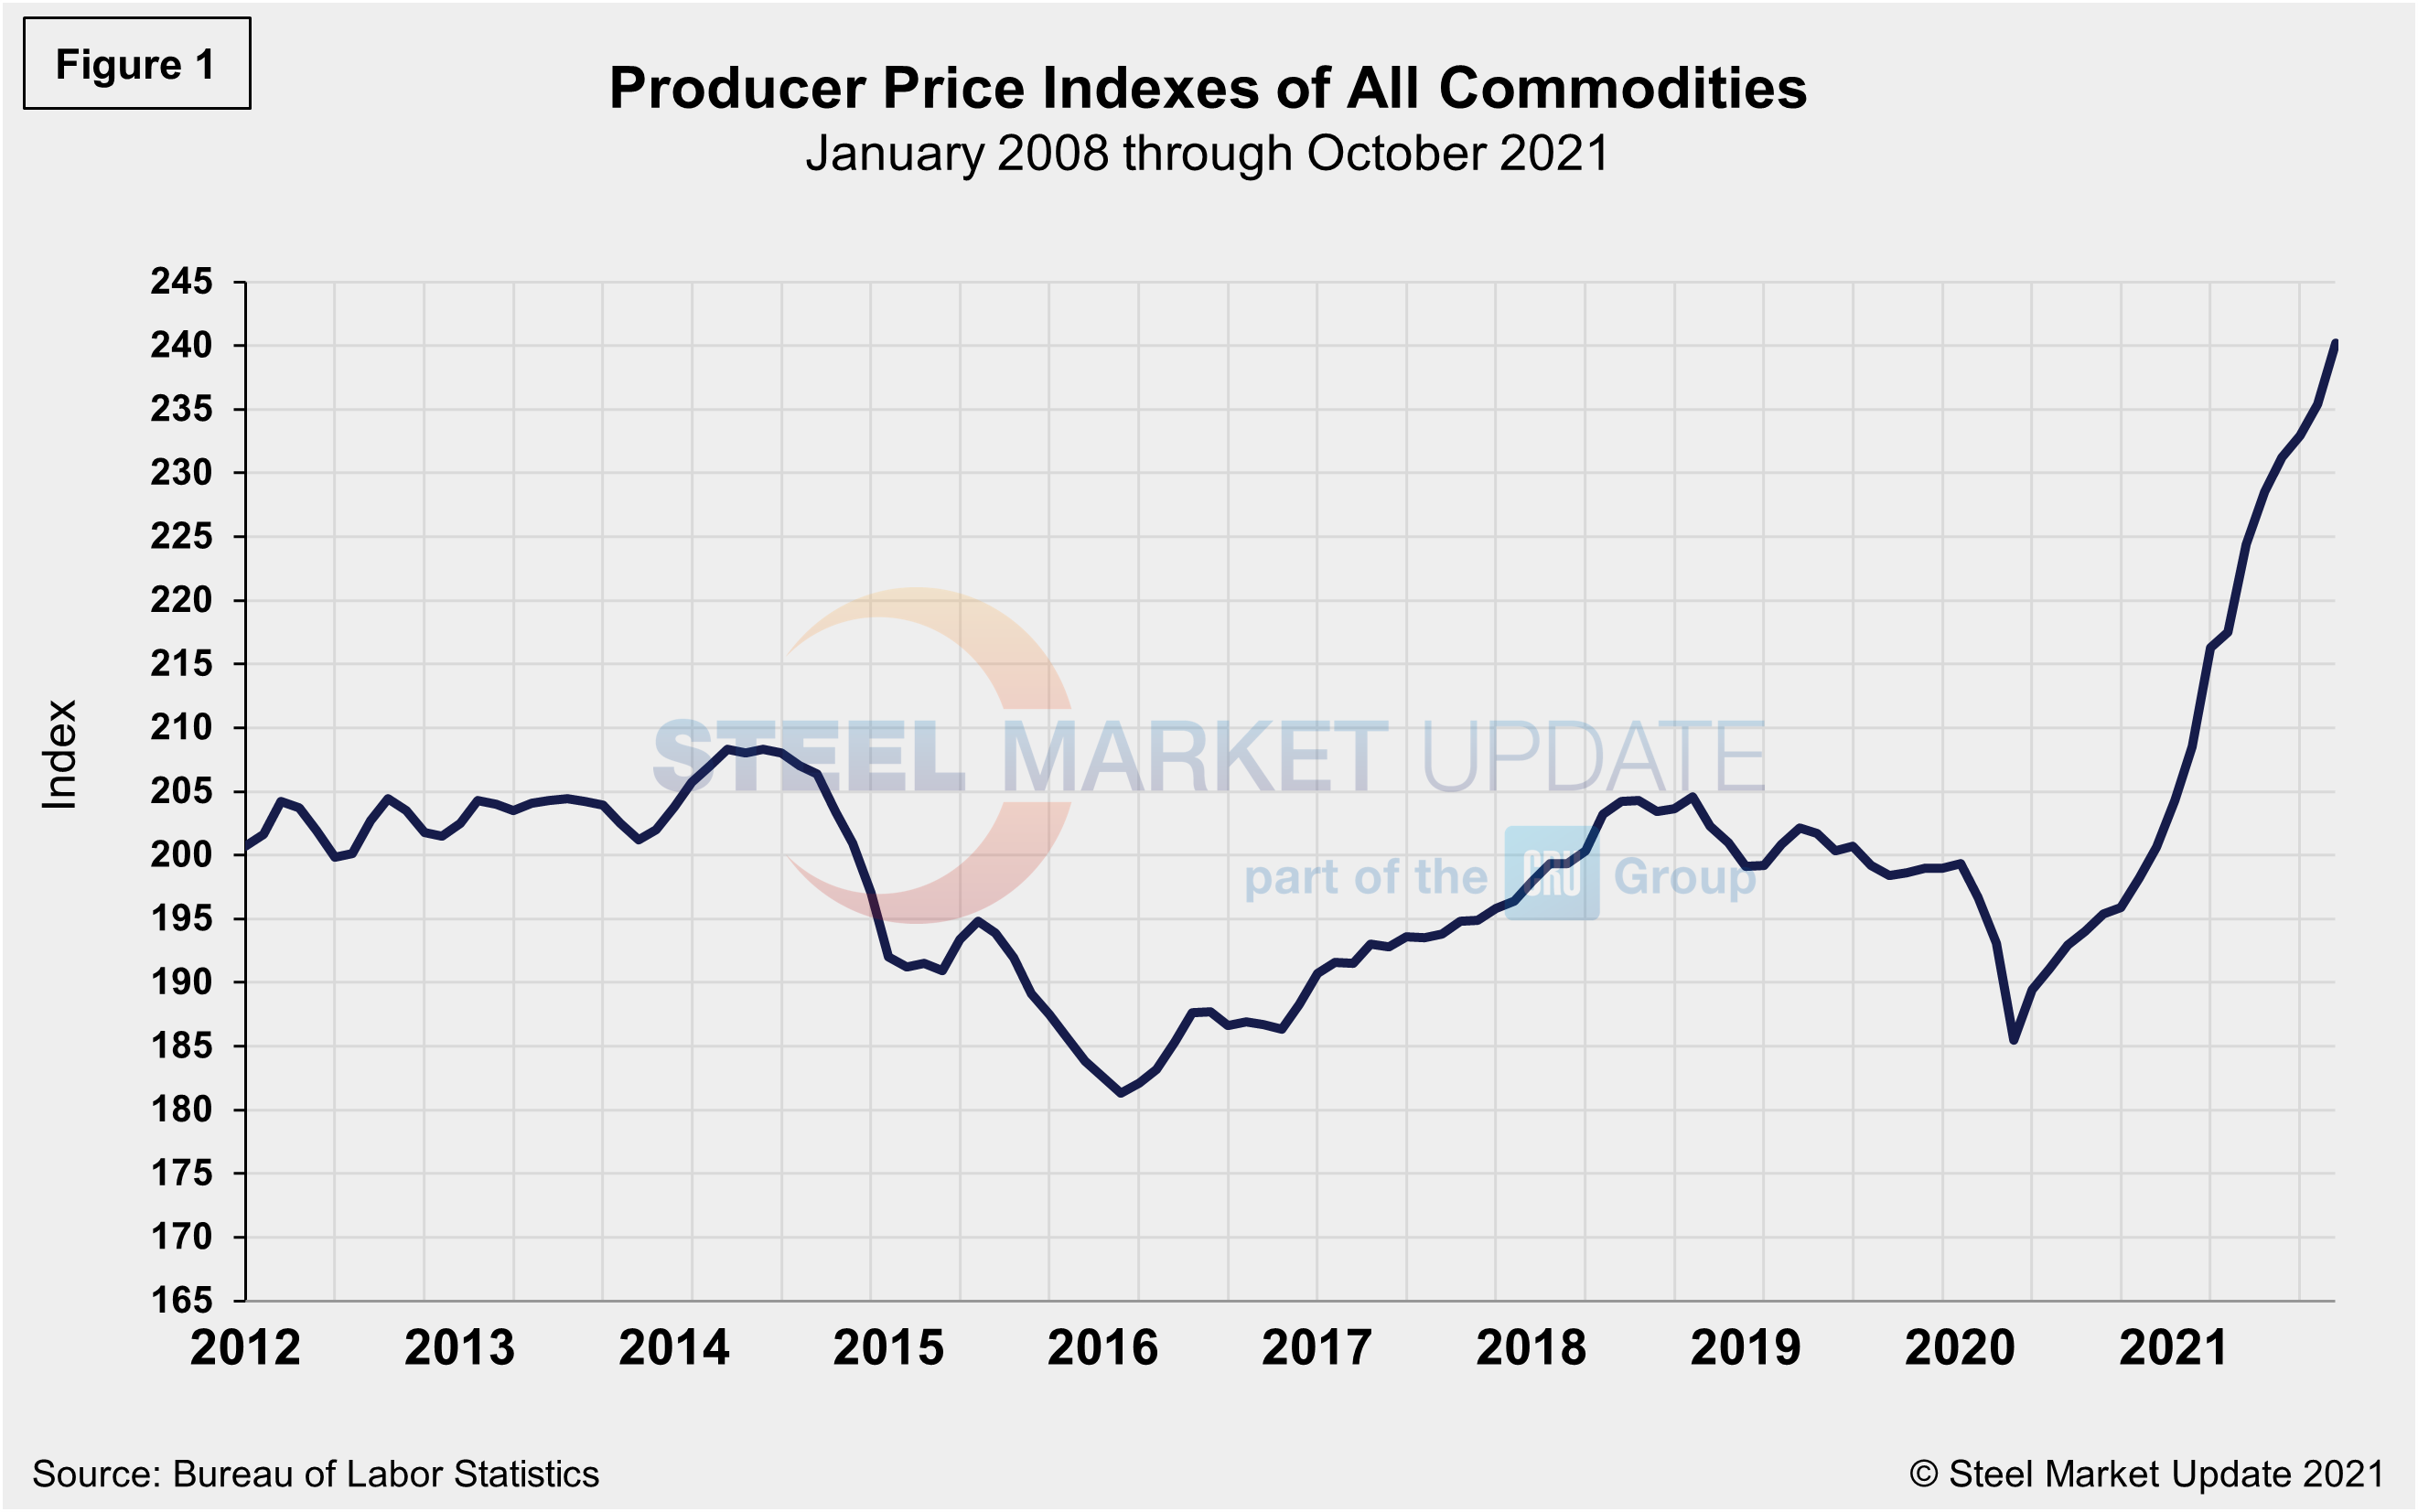
Since falling in early 2020, the composite Producer Price Index (PPI) of all commodities from the Bureau of Labor Statistics (BLS) has gained ground month-on-month for 18 consecutive months, fully recovering from the pandemic-driven collapse, and overtaking pre-pandemic levels by nearly 40 points. October’s index registered a 0.6% gain against the prior month, seasonally adjusted. Additionally, the index is up 8.6% for the 12 months ended October 2021, matching the largest advance since 12-month data were first calculated in November 2010.
The PPI data, which cover more than 10,000 goods and services, is helpful in comparing the direction of price changes in the short and medium term. In specific, this analysis is intended to provide subscribers with a view of the relative competitive positions of sheet steel, aluminum, plastic and wood. It also includes some downstream products and a comparison of truck and rail transportation.
The composite PPI for all commodities (Figure 1) tumbled by more than 4.0% at the onset of the pandemic last spring. The recovery has been outstanding for the U.S. economy and historic for the steel industry. On an unadjusted basis, the final demand index moved up 21.2% for the 12 months ended in October. The PPI was at 240.2 in October, up from 235.4 in September, and from 198.6 one year ago.
SMU’s benchmark hot-rolled coil price range stood at $1,775-$1,935 per net ton, an average of $1,855 per ton FOB mill, east of the Rockies as of Nov. 9, edging down $65 per net ton since our last PPI report last month. The past year’s surge in steel prices, which have peaked and are now on a slow descent, still align with a slowdown in the rate of growth across producer prices.
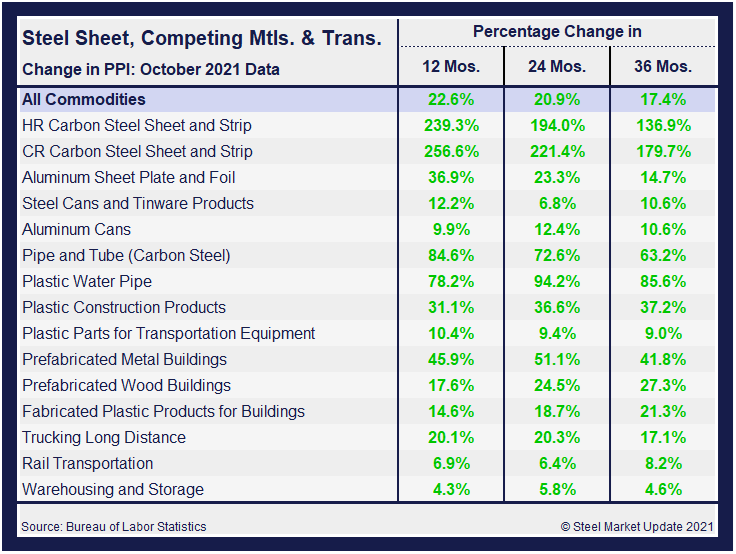
A summary of each segment on a year over one-, two- and three-year basis is shown in the table below. The gain/loss pattern is shown by the color codes; rising prices are considered positive. The positive swing on a 12-month basis is not a surprise, especially after the initial pandemic-driven slowdown and subsequent rebound. The growth at the 24-month and 36-month level, however, is notable, further reinforcing this historic recovery and growth trajectory for the overall economy since the initial COVID doldrums. Through October, all 16 sectors are on the rise at the 12-month level, with HR and CR carbon steel sheet and strip showing huge increases of 239.3% and 256.6%, respectively. The 24-month and 36-month increases are of even greater impact, as they include pre-pandemic periods.
The table includes direct comparisons where possible between steel and competing products, while also including plastic products, transportation, warehousing and storage to further highlight current market conditions. Even though there may not be a direct or specific comparison of steel, these PPI numbers clearly match the trend of rising demand and prices seen across the steel market. Construction-related products are up anywhere from 14.6% to 84.6% at the 12-month level, with similar increases for the 24- and 36-month periods as well. The marketplace has been resilient, surpassing every speculated high. The recent slowdown in the rate of rise may indicate that the upward momentum is running out of steam and nearing the top, as we’ve now seen with HRC.
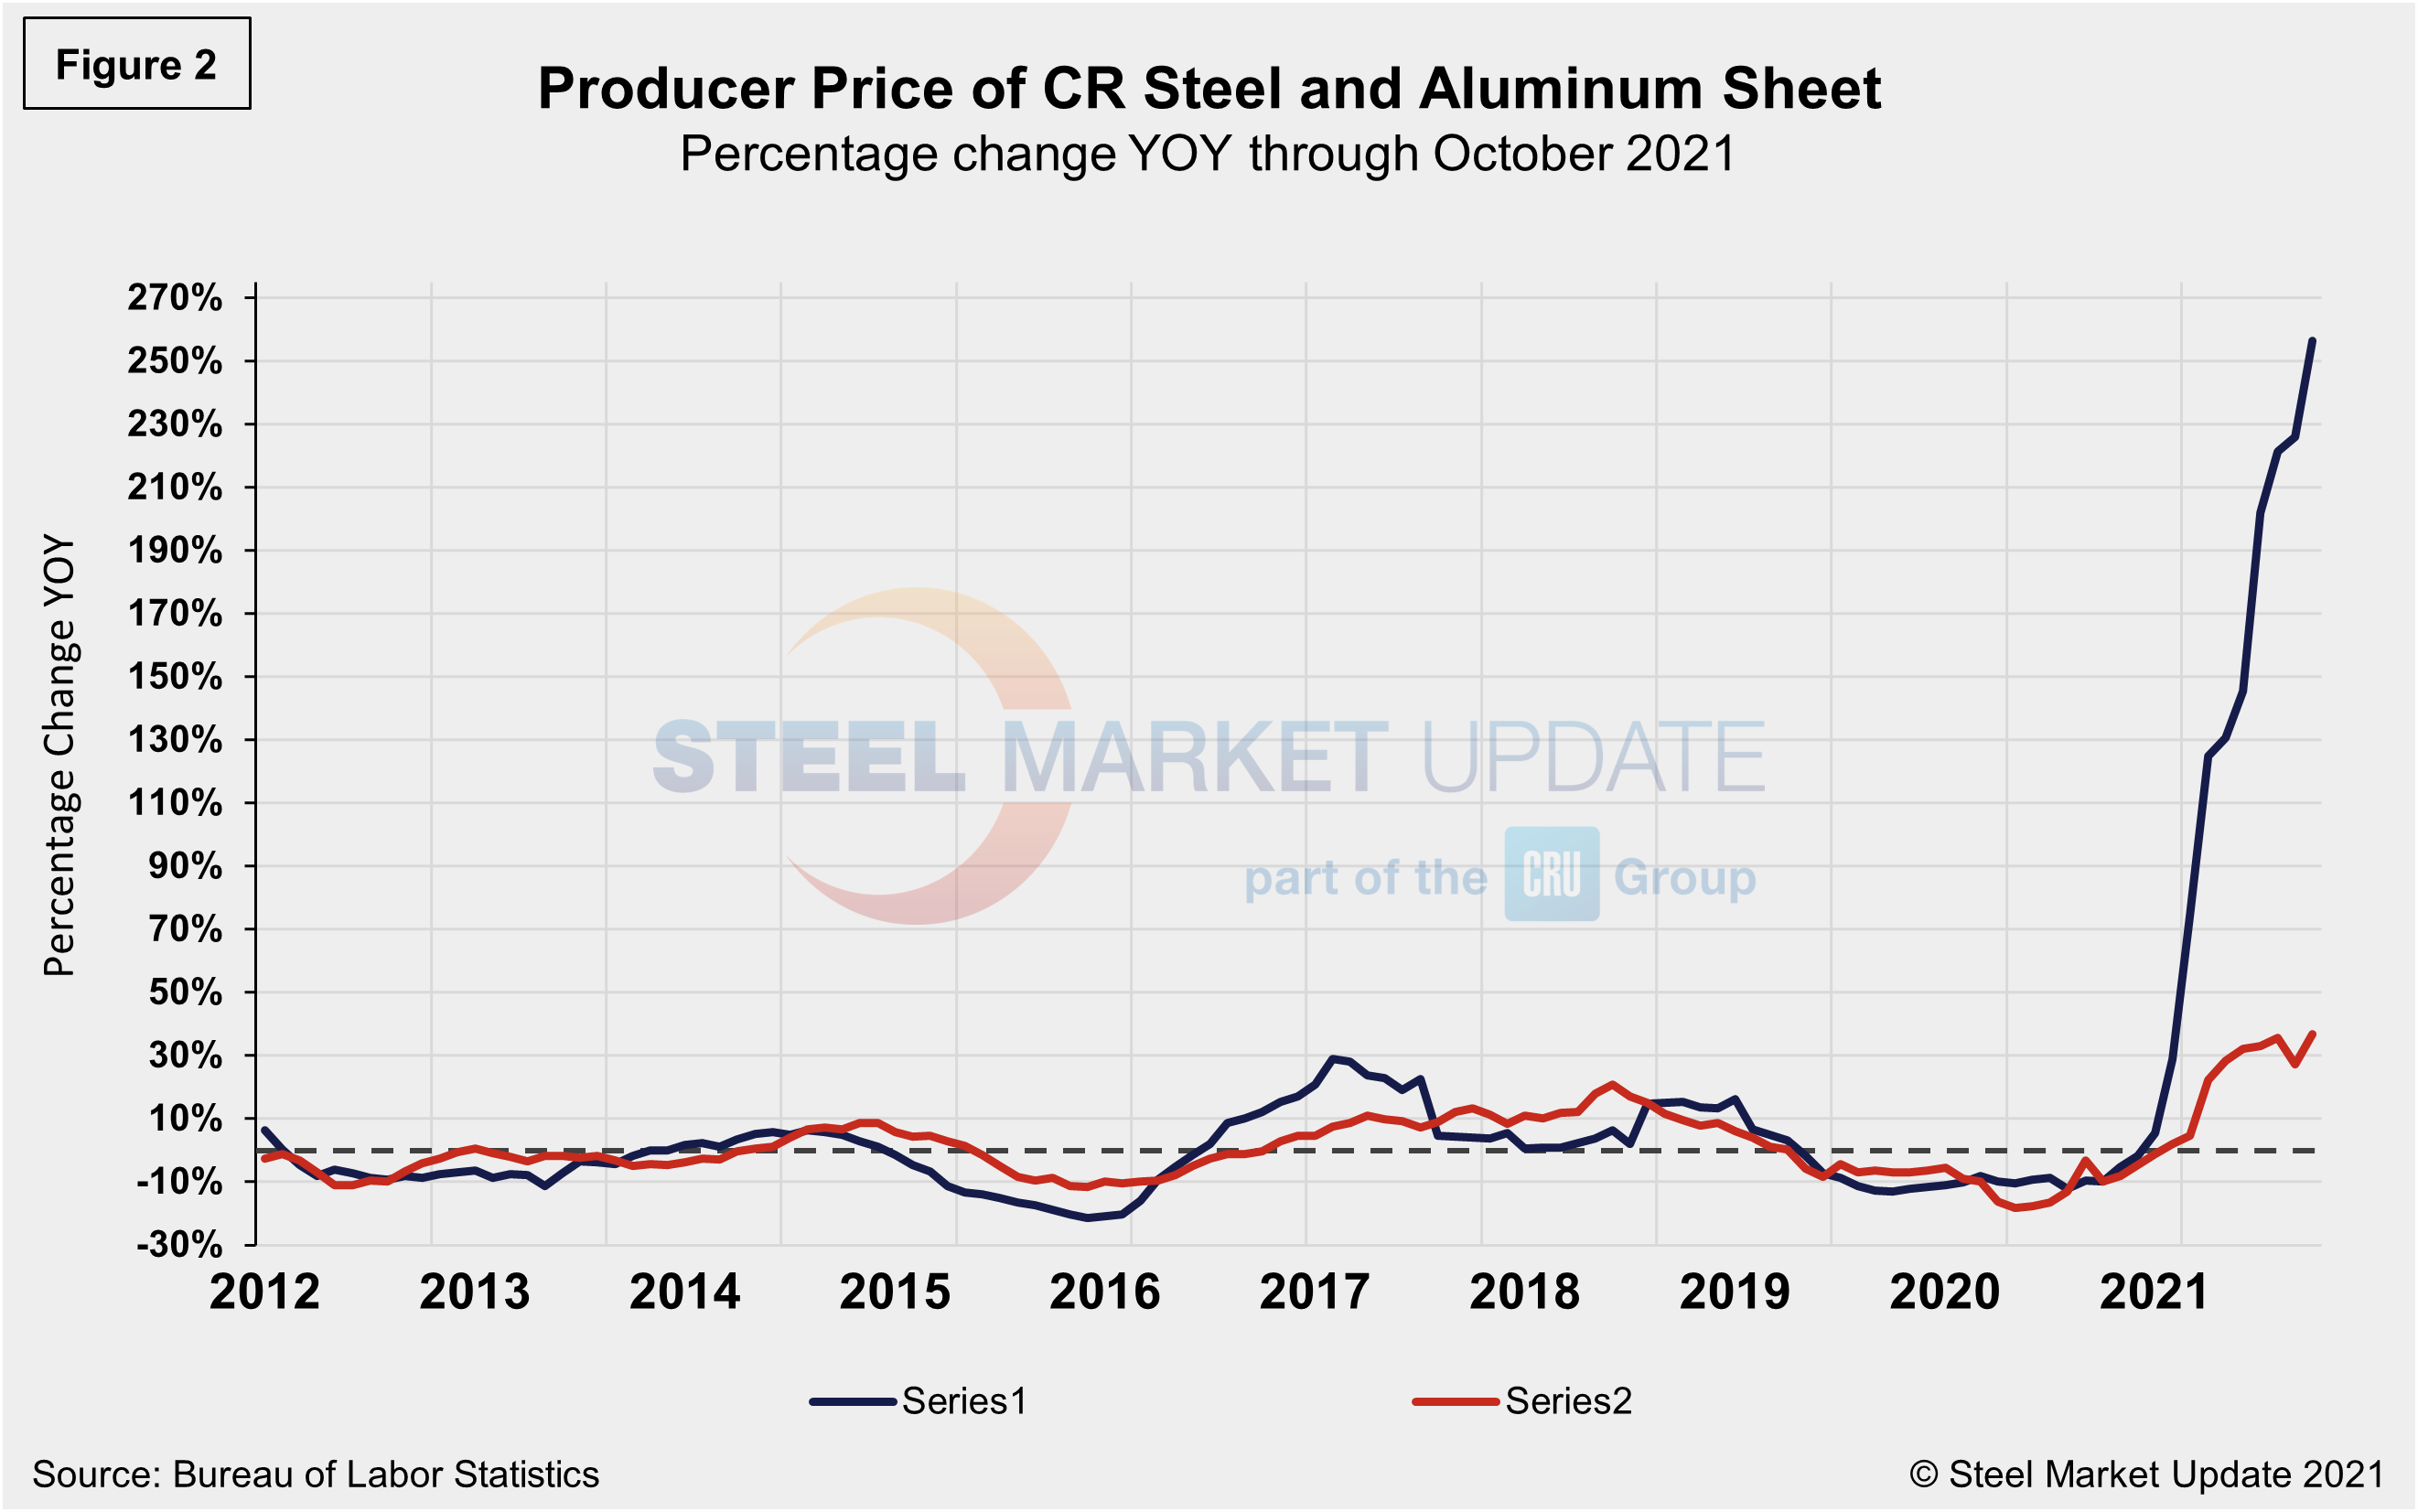
Both steel and aluminum products (Figure 2) have now easily overtaken pre-pandemic PPI figures and reached recent highs. Steel products, however, have begun showing signs of slowing down, while aluminum products have already started a descent. Comparing the price changes of cold rolled steel sheet and flat rolled aluminum, both recovered from last year’s losses and reached historic highs. The trajectory in cold rolled steel sheet prices has certainly dwarfed the impressive rebound in flat rolled aluminum. Cold rolled steel, though, had shown signs of slowing momentum, but a recent acceleration pushed prices up month on month.
Cold rolled steel prices reached positive territory in January for the first time since April 2019 and have since jumped by 256.6% through October. Flat rolled aluminum, by comparison, is presently at 36.9%, down 1.6 percentage points from September’s total. Cold rolled steel price gains have shown significant growth since July, and had exceeded the growth rate on a percentage basis of hot rolled steel prices. In October, cold rolled rose 8.2% month on month, compared to a 3.5% increase for hot rolled.
Although aluminum prices are still well behind steel in terms of growth, they had a strong run, improving month on month for nearly a year since last October. In contrast, steel tinware and aluminum cans have remained largely stable over the past 15 months, as their gains and losses have not been as accentuated. Steel tinware was up 0.5% in October, while aluminum cans rose 2.4% over the same period. They remain up 12.2% and 9.9% year on year through October, respectively.
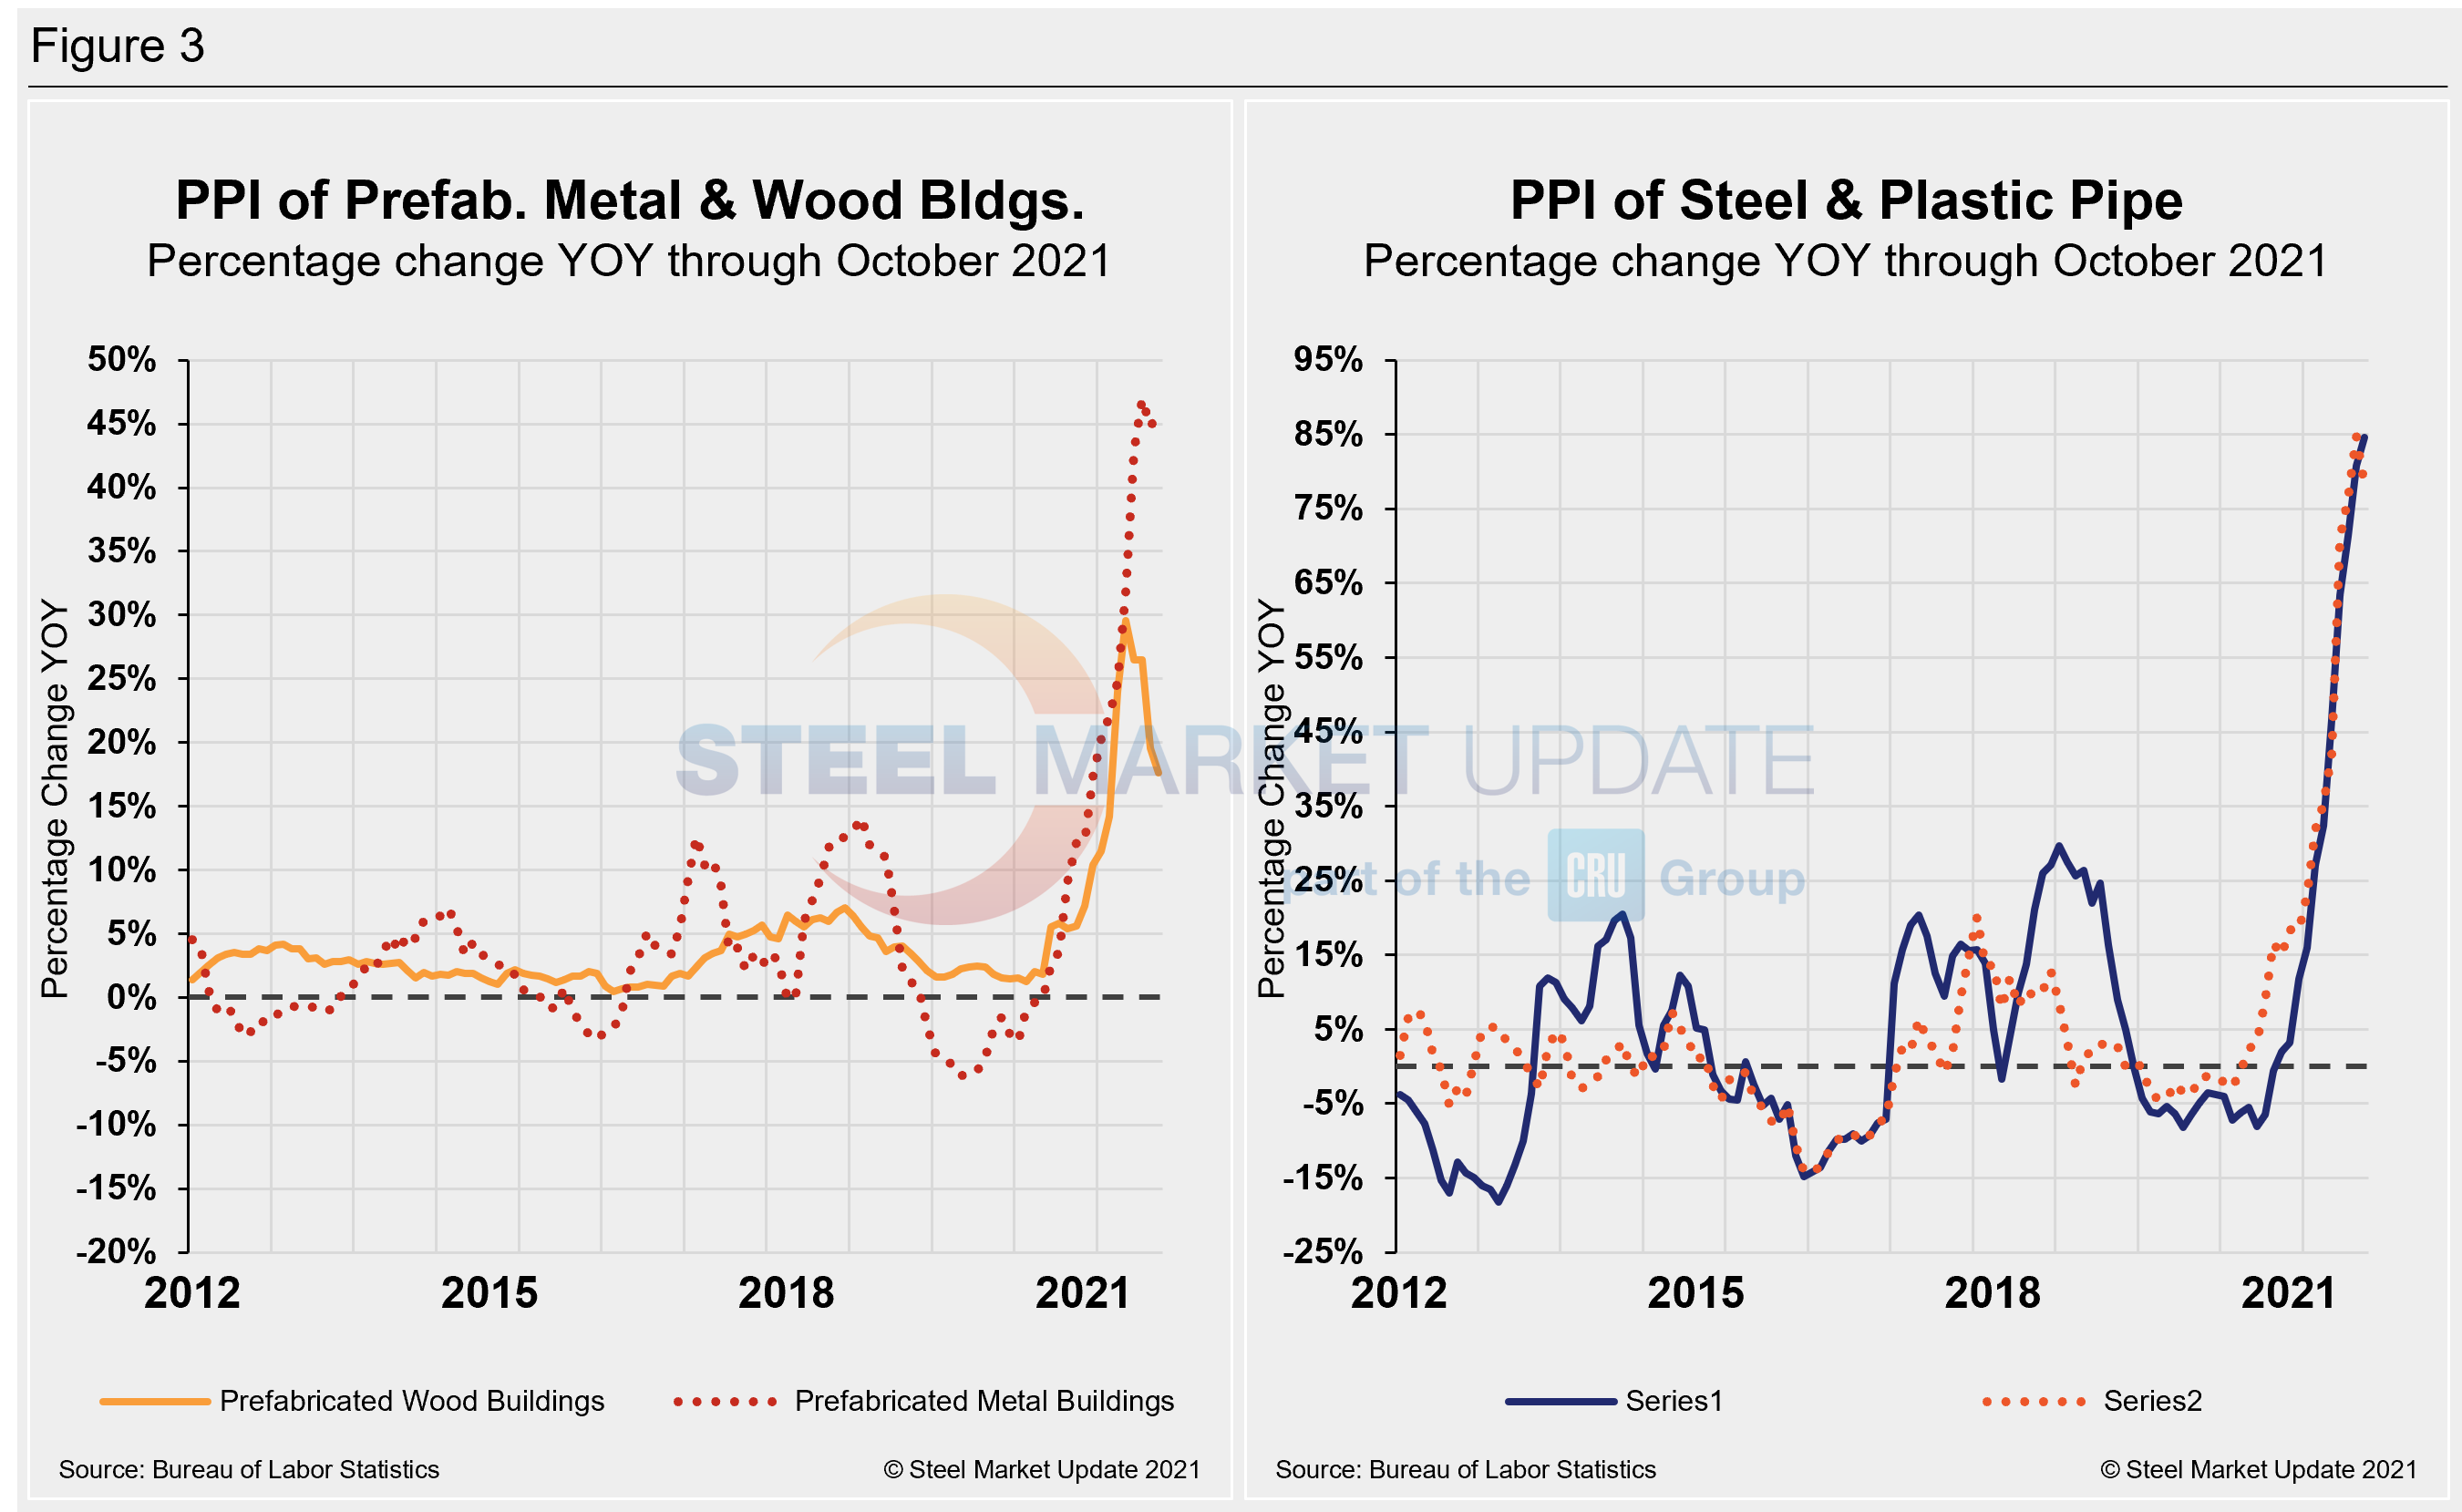
Prices of prefabricated metal buildings and prefabricated wood buildings have both seen significant increases since the beginning of 2021, but the rate of growth has slowed over the past few months, with prices for prefabricated wood buildings edging down for the second consecutive month in October. Prefabricated steel building prices fell to a negative 3.5% last June, but rallied to a positive by 45.9% over 15 months. A similar trend was seen for prefabricated wood buildings over the same period, at 17.6% growth. Momentum has slowed since, as a 1.2% decrease was seen for prefabricated wood buildings in October, while prefabricated metal buildings edged up just 0.8% month on month.
The prices of steel and plastic pipe have both experienced big swings due to COVID-19 as well. Steel pipe prices dropped to a negative 8.0% through September last year, but rallied to a positive 84.6% 13 months on, with a 3.3% increase in October. By comparison, plastic pipe has rallied by nearly 66.0% since January, reaching a positive 78.2% growth in October on a year-on-year basis. Figure 3 is a side-by-side comparison of prefabricated buildings and pipe price dynamics.
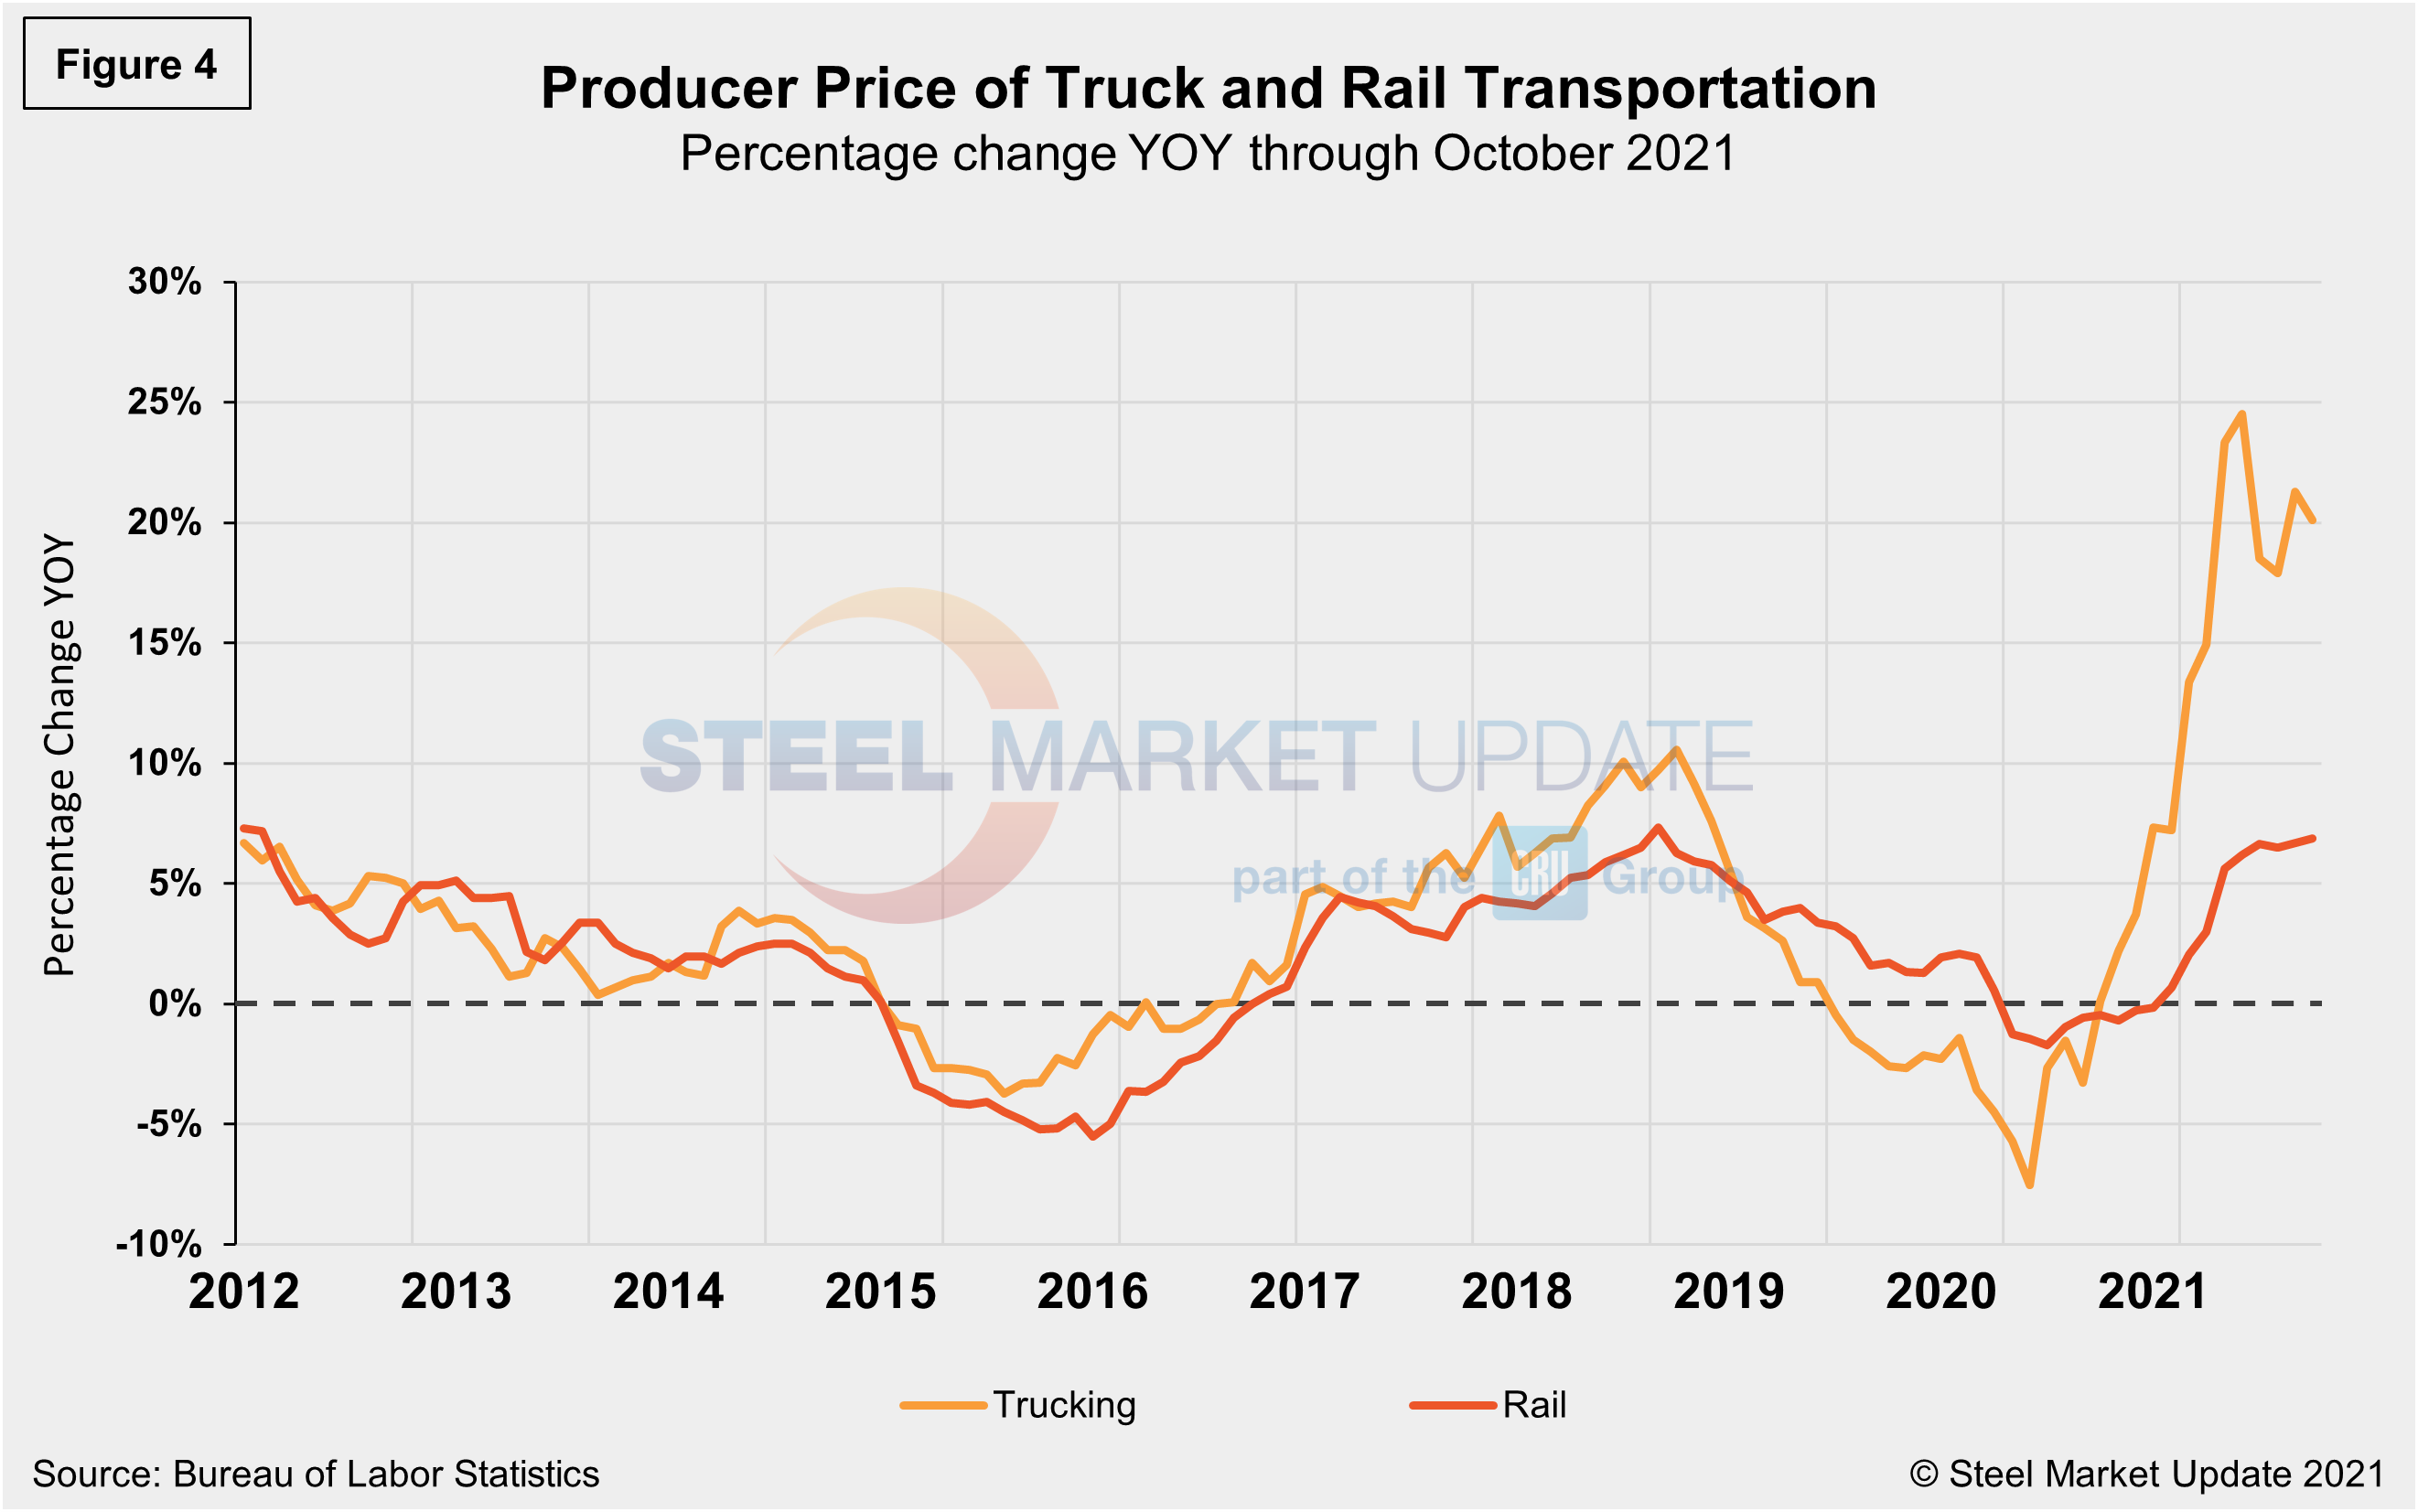
The growth of truck transportation prices has far exceeded those of rail (Figure 4) since they both bottomed out in June of last year. Rail dipped to a negative 1.7% last June and has since slowly corrected to a positive 6.9% through October 2021. Long distance trucking, on the other hand, recovered to positive 20.1% in October after falling to negative 7.5% last July. Although the rate of rise for both have eased of late, the increased freight pricing over the past year has been a compounding factor to steel buyers dealing with historically high finished steel prices. Even though long-distance grew by 2.8% month on month, freight costs have experienced the most significant increase in more than a decade.
Warehousing and storage prices also have risen. After initially falling to a negative 2.3% at the onset of the global pandemic, they had rebounded to a positive 6.6% through July. After slipping 1.7% in August, they have recovered consecutively in September and October, presently up 1.5% month on month.
The official description of this program from the BLS reads as follows: “The Producer Price Index (PPI) is a family of indexes that measure the average change over time in the prices received by domestic producers of goods and services. PPIs measure price change from the perspective of the seller. This contrasts with other measures, such as the Consumer Price Index (CPI). CPIs measure price changes from the purchaser’s perspective. Sellers’ and purchasers’ prices can differ due to government subsidies, sales and excise taxes, and distribution costs. More than 10,000 PPIs for individual products and groups of products are released each month. PPIs are available for the products of virtually every industry in the mining and manufacturing sectors of the U.S. economy. New PPIs are gradually being introduced for the products of industries in the construction, trade, finance, and services sectors of the economy. More than 100,000 price quotations per month are organized into three sets of PPIs: (1) stage-of-processing indexes, (2) commodity indexes, and (3) indexes for the net output of industries and their products. The stage-of-processing structure organizes products by class of buyer and degree of fabrication. The commodity structure organizes products by similarity of end use or material composition. The entire output of various industries is sampled to derive price indexes for the net output of industries and their products.
By David Schollaert, David@SteelMarketUpdate.com


